Tectonic Map 35M (TeMaW)
(in progress)
The New Tectonic Map is being made in a spherical Mercator projection with the principal meridian positioned centrally and polar stereographic projection for the Northern and Southern Hemispheres. The GIS-project of the new Tectonic Map is based on the Geological Map of the World at 1:5M scale completed by the CGMW in 2014.
|
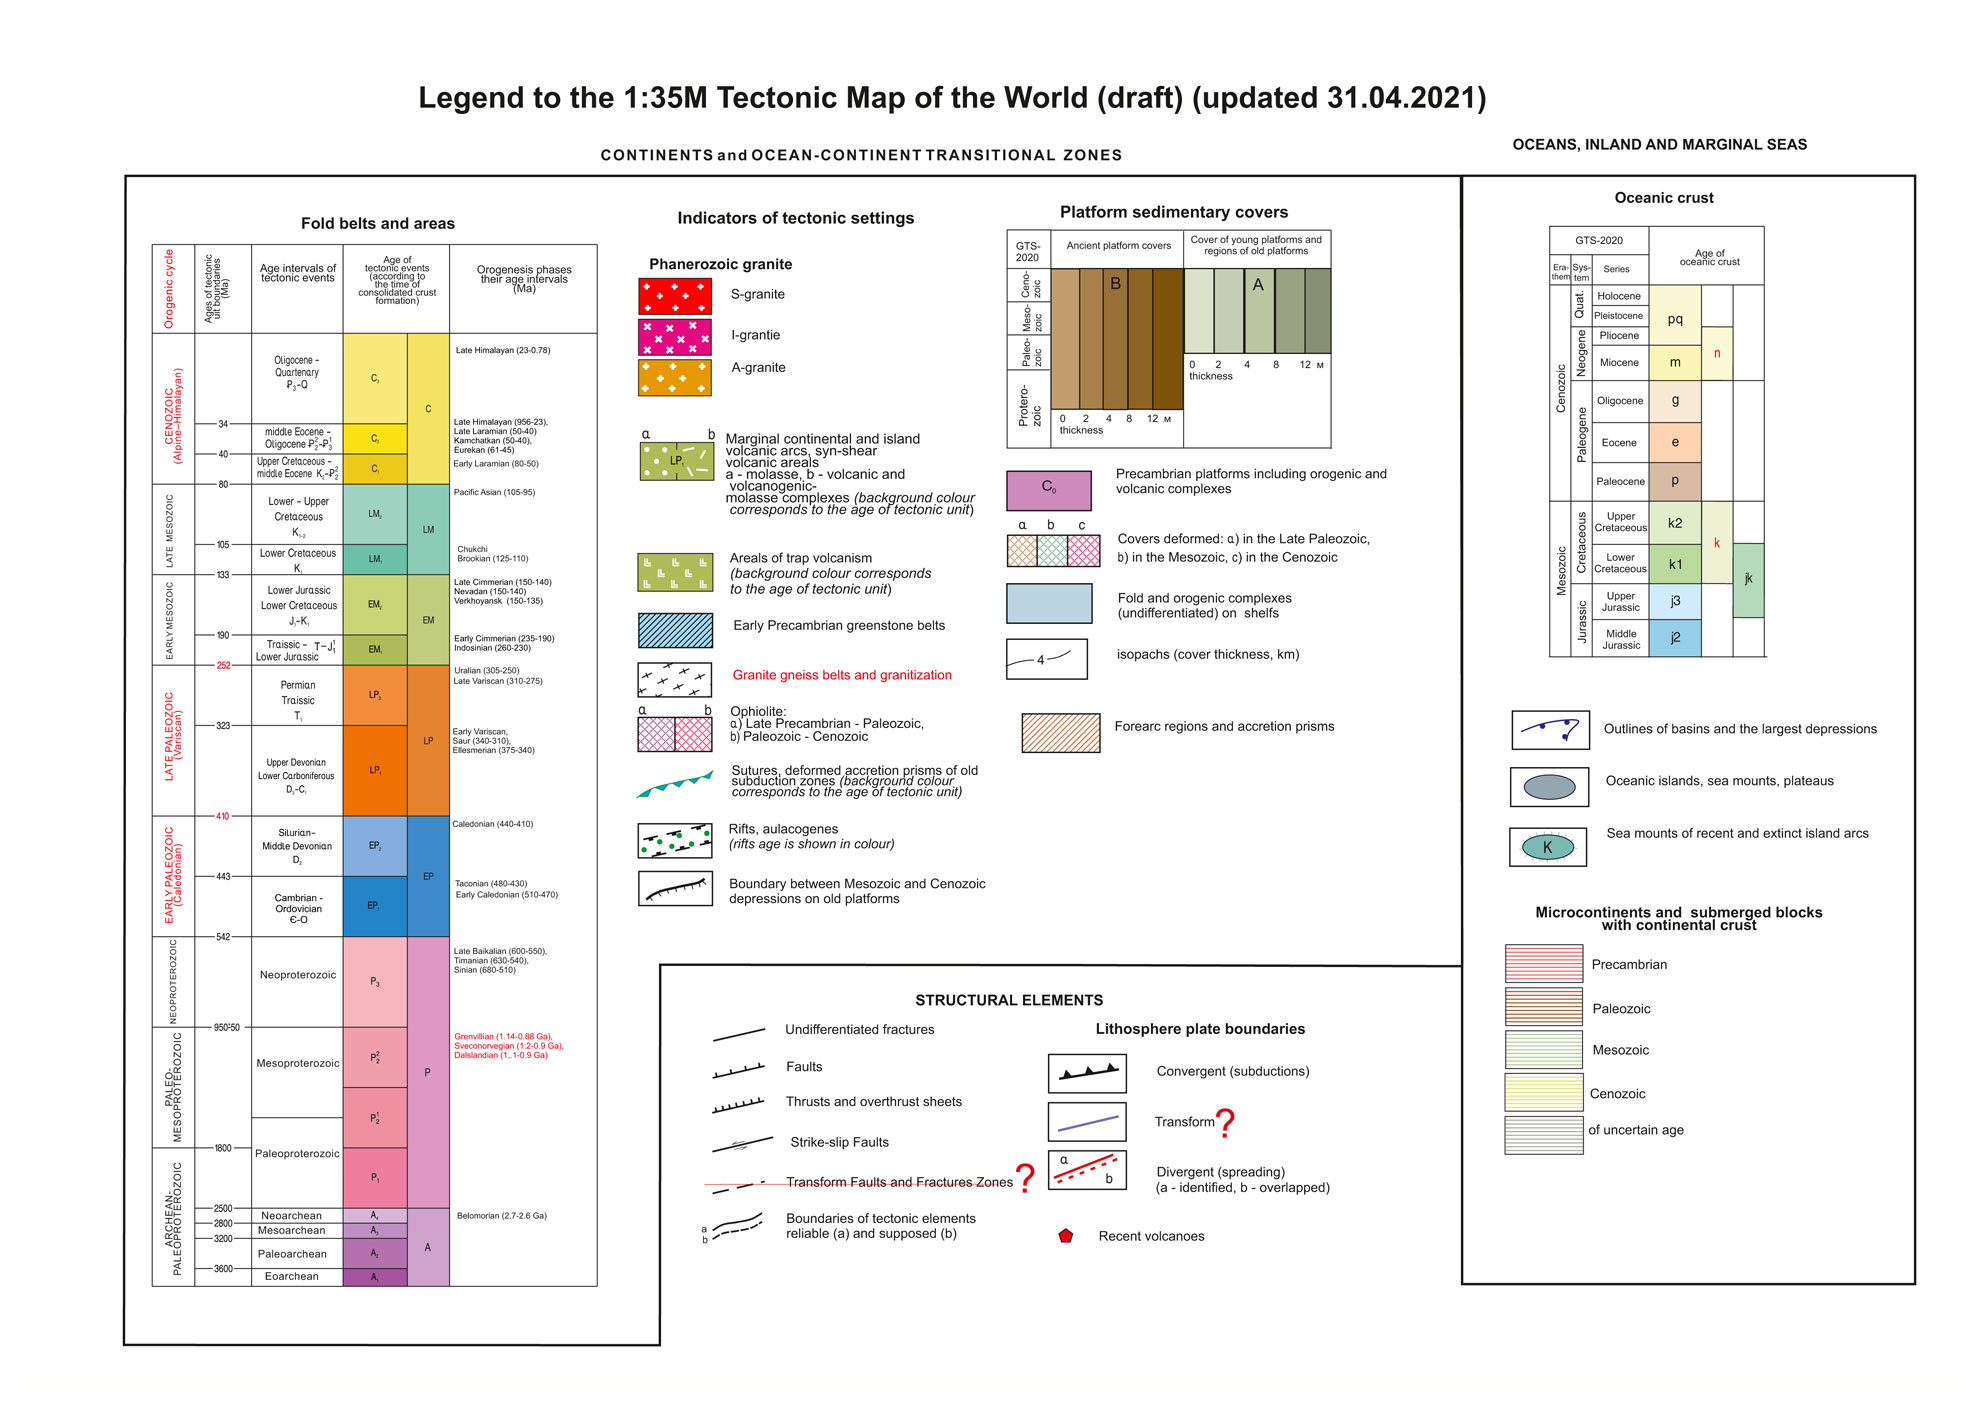
LEGEND FOR THE NEW TECTONIC MAP OF THE WORLD 1:35М (in progress)
The legend for the new Tectonic Map takes advantage of modern principles used while developing the legends for the Tectonic Maps of the Arctic (2019) and Asia (2016) at 1:2.5M scale with the consideration of the scale 1:35M as well as the legend for the Tectonic Map by V. Khain and Yu. Leonov (1982). It also uses principles and approaches of the legends for the recent tectonic maps of Africa at 1:10M scale (2010), Antarctica at 1:10 M scale (2012) and South America at 1:5M scale (2016) compiled as part of CGMW activities.
High resolution archive
|
THEMATIC LAYERS FOR THE NEW TECTONIC MAP OF THE WORLD 1:35М
|
|
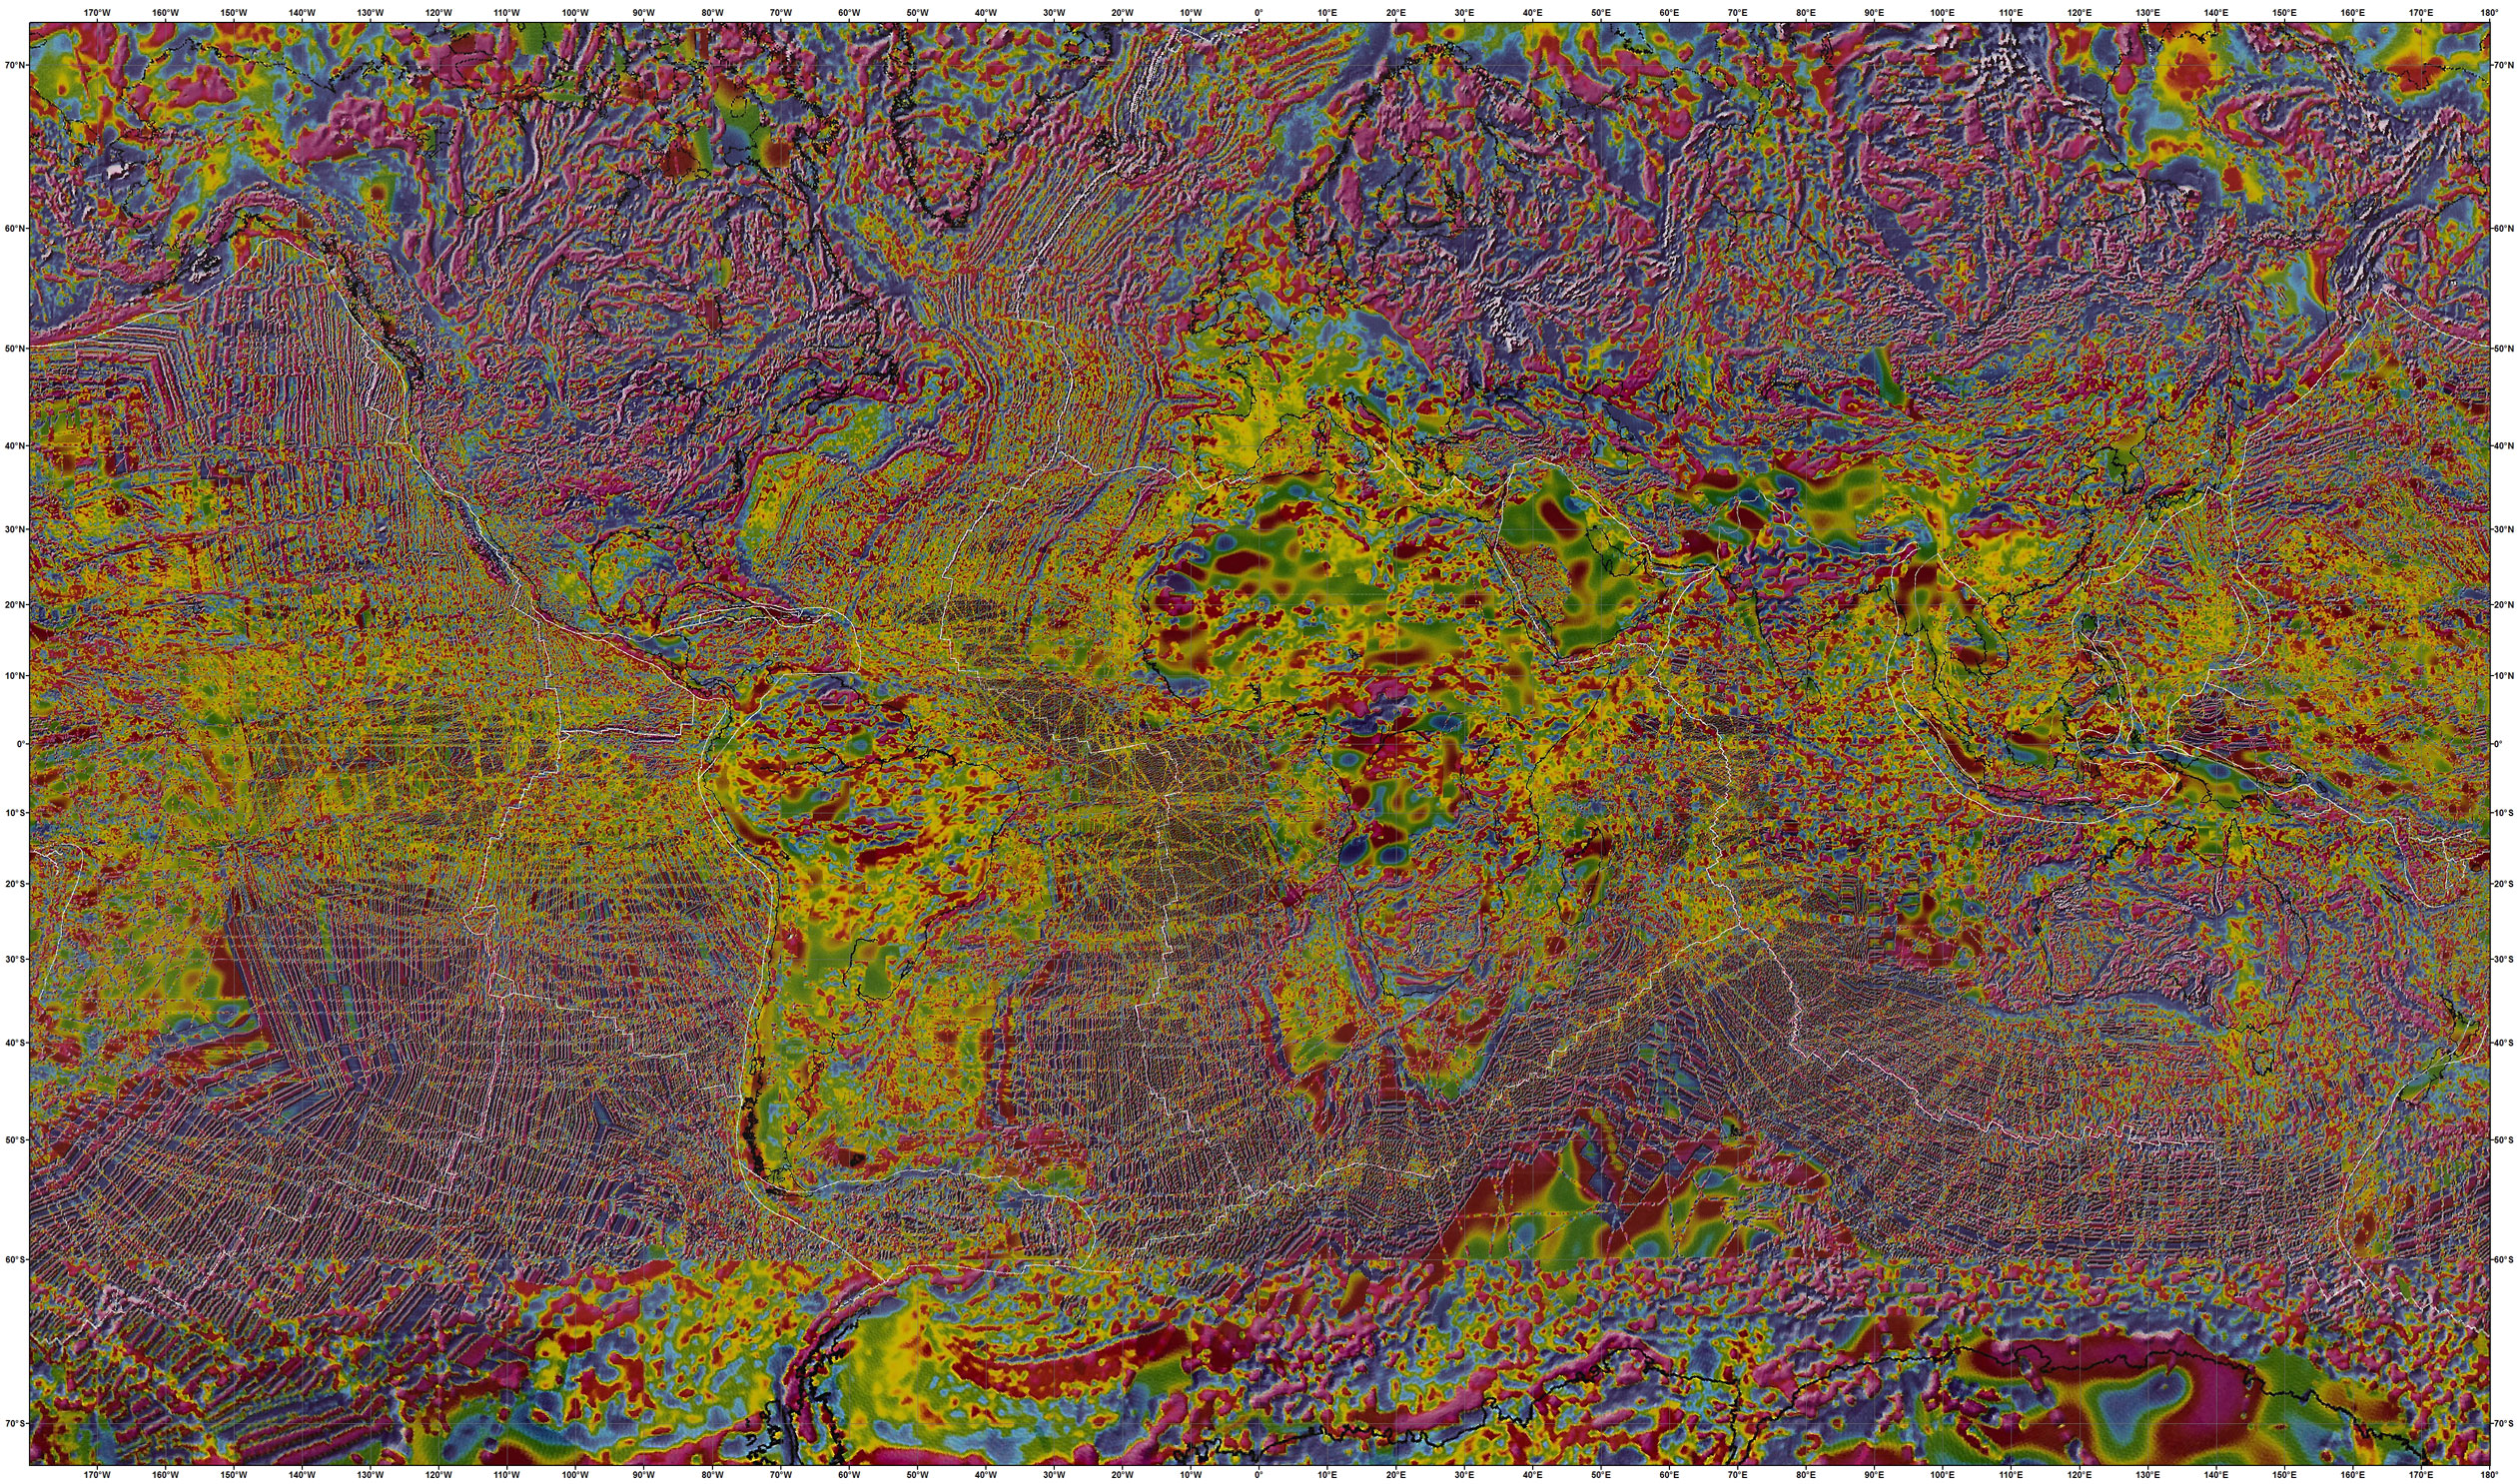
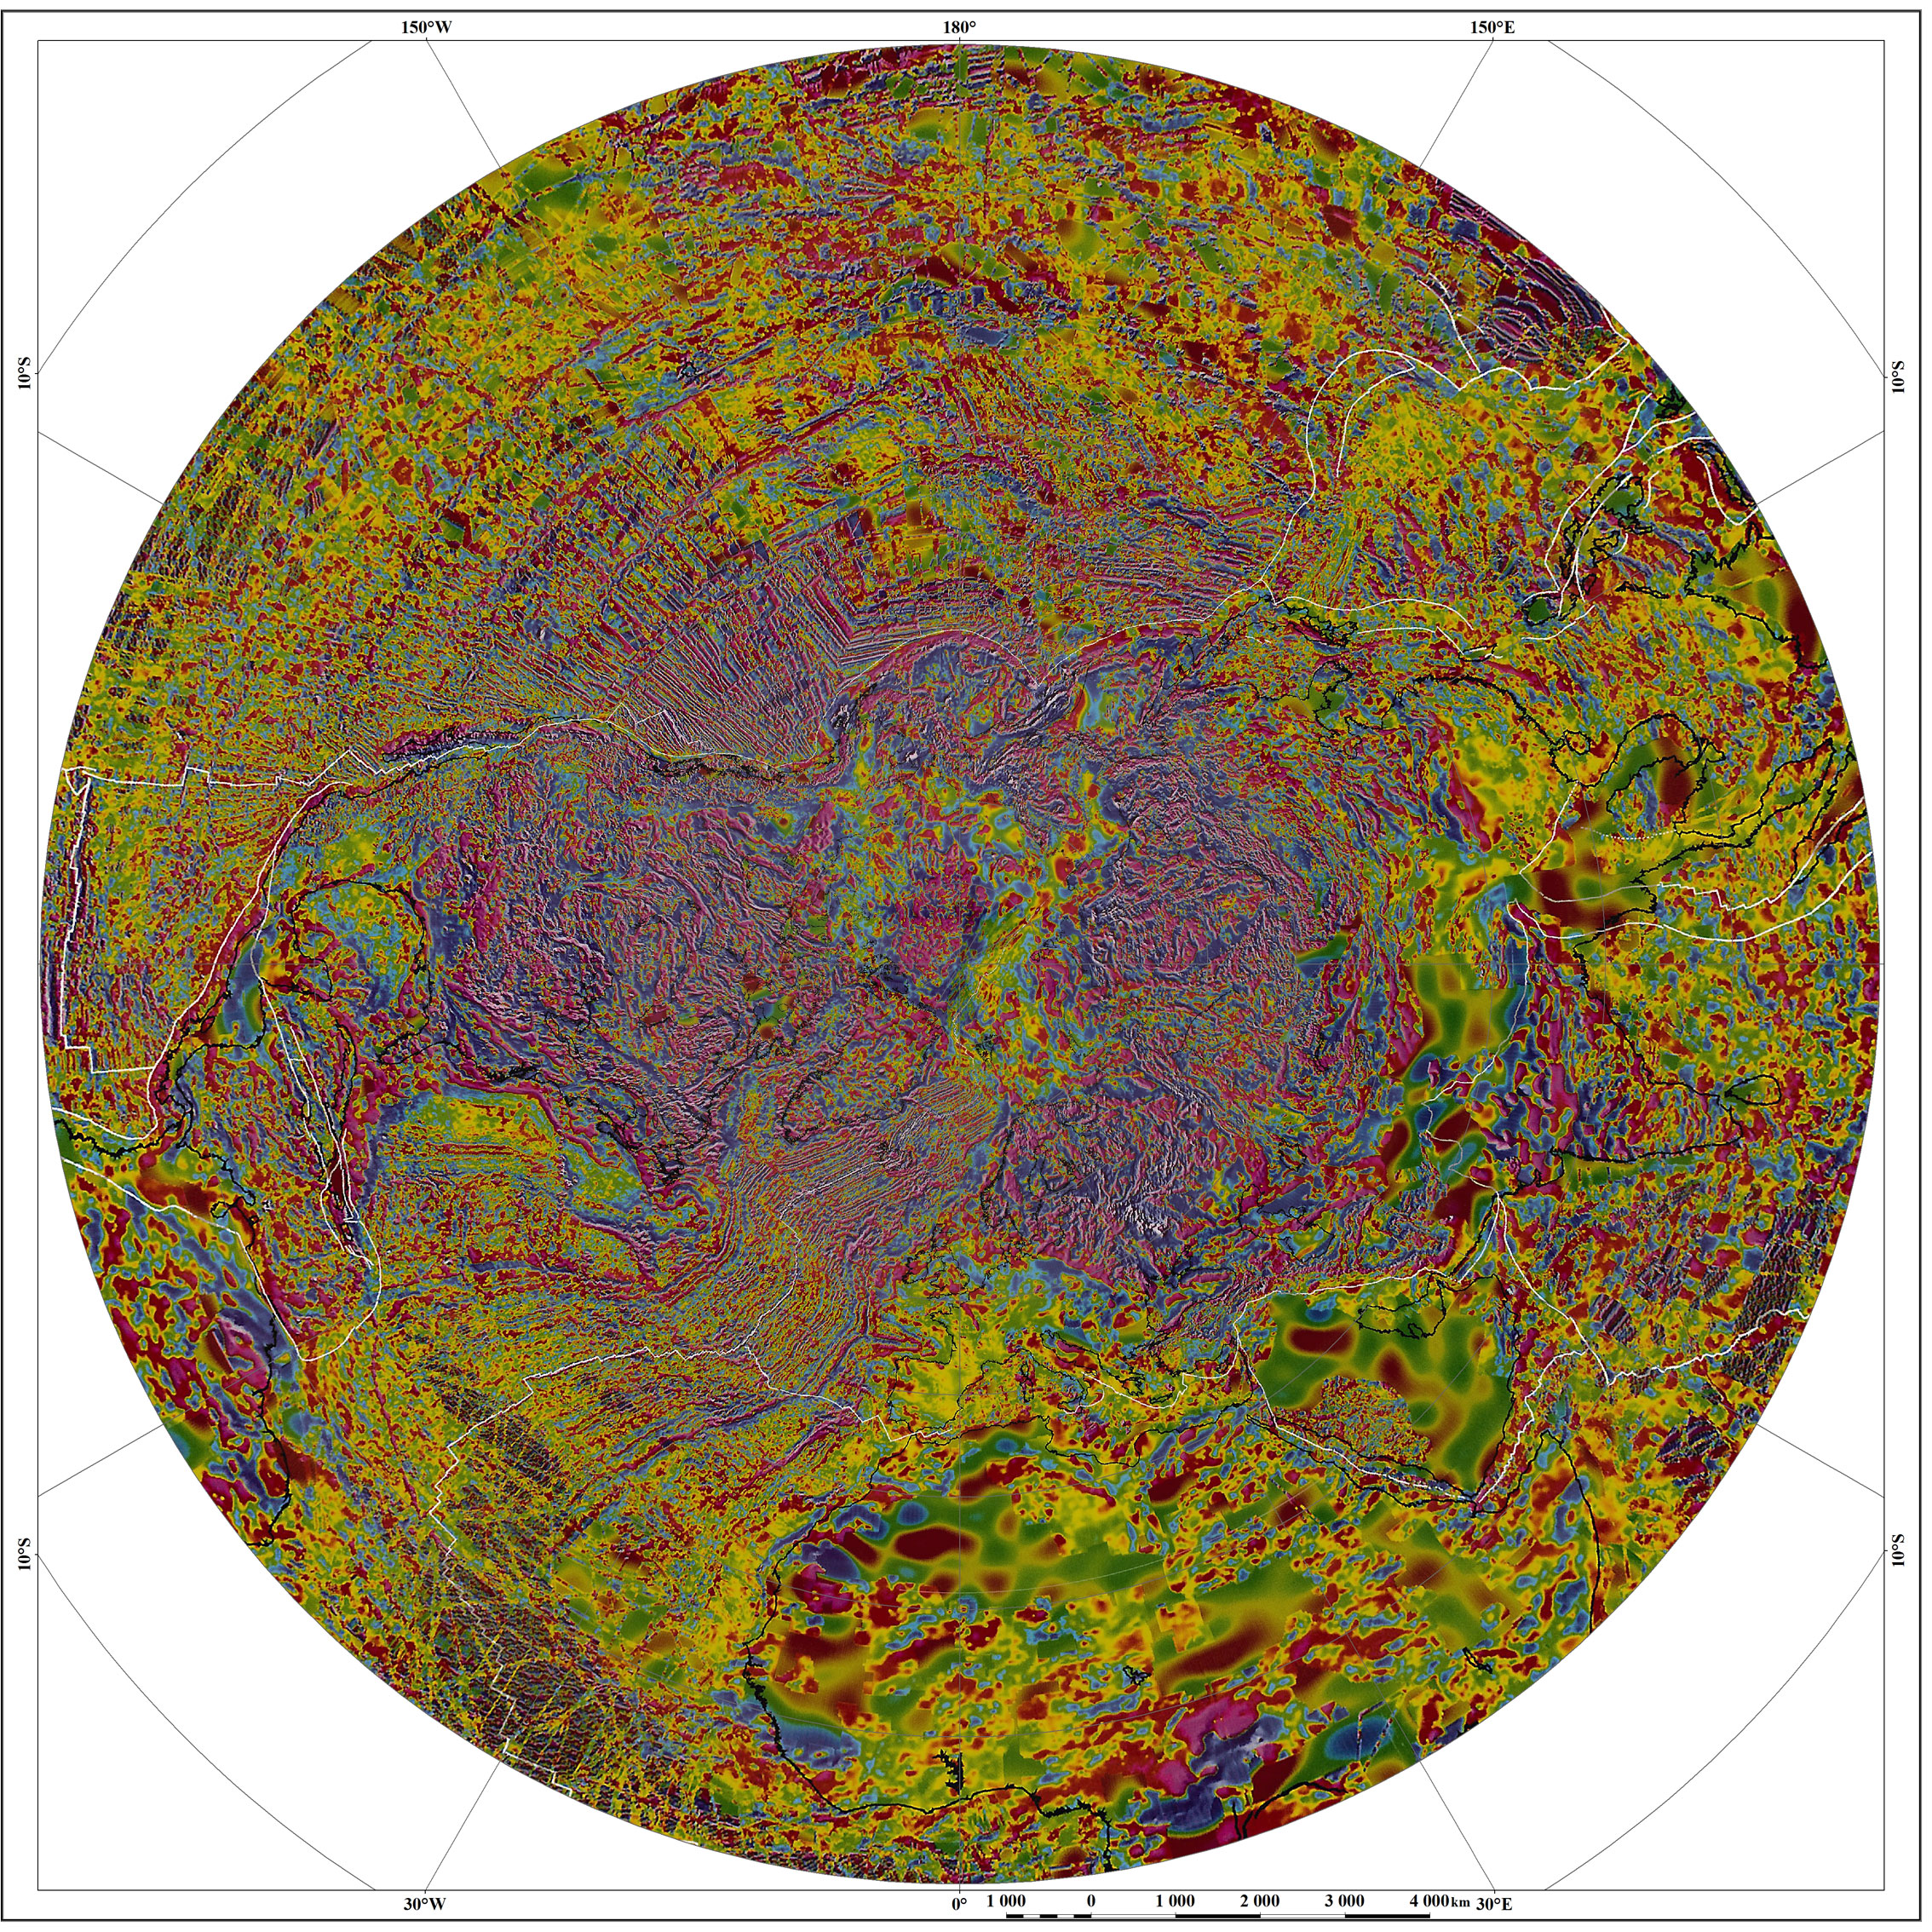
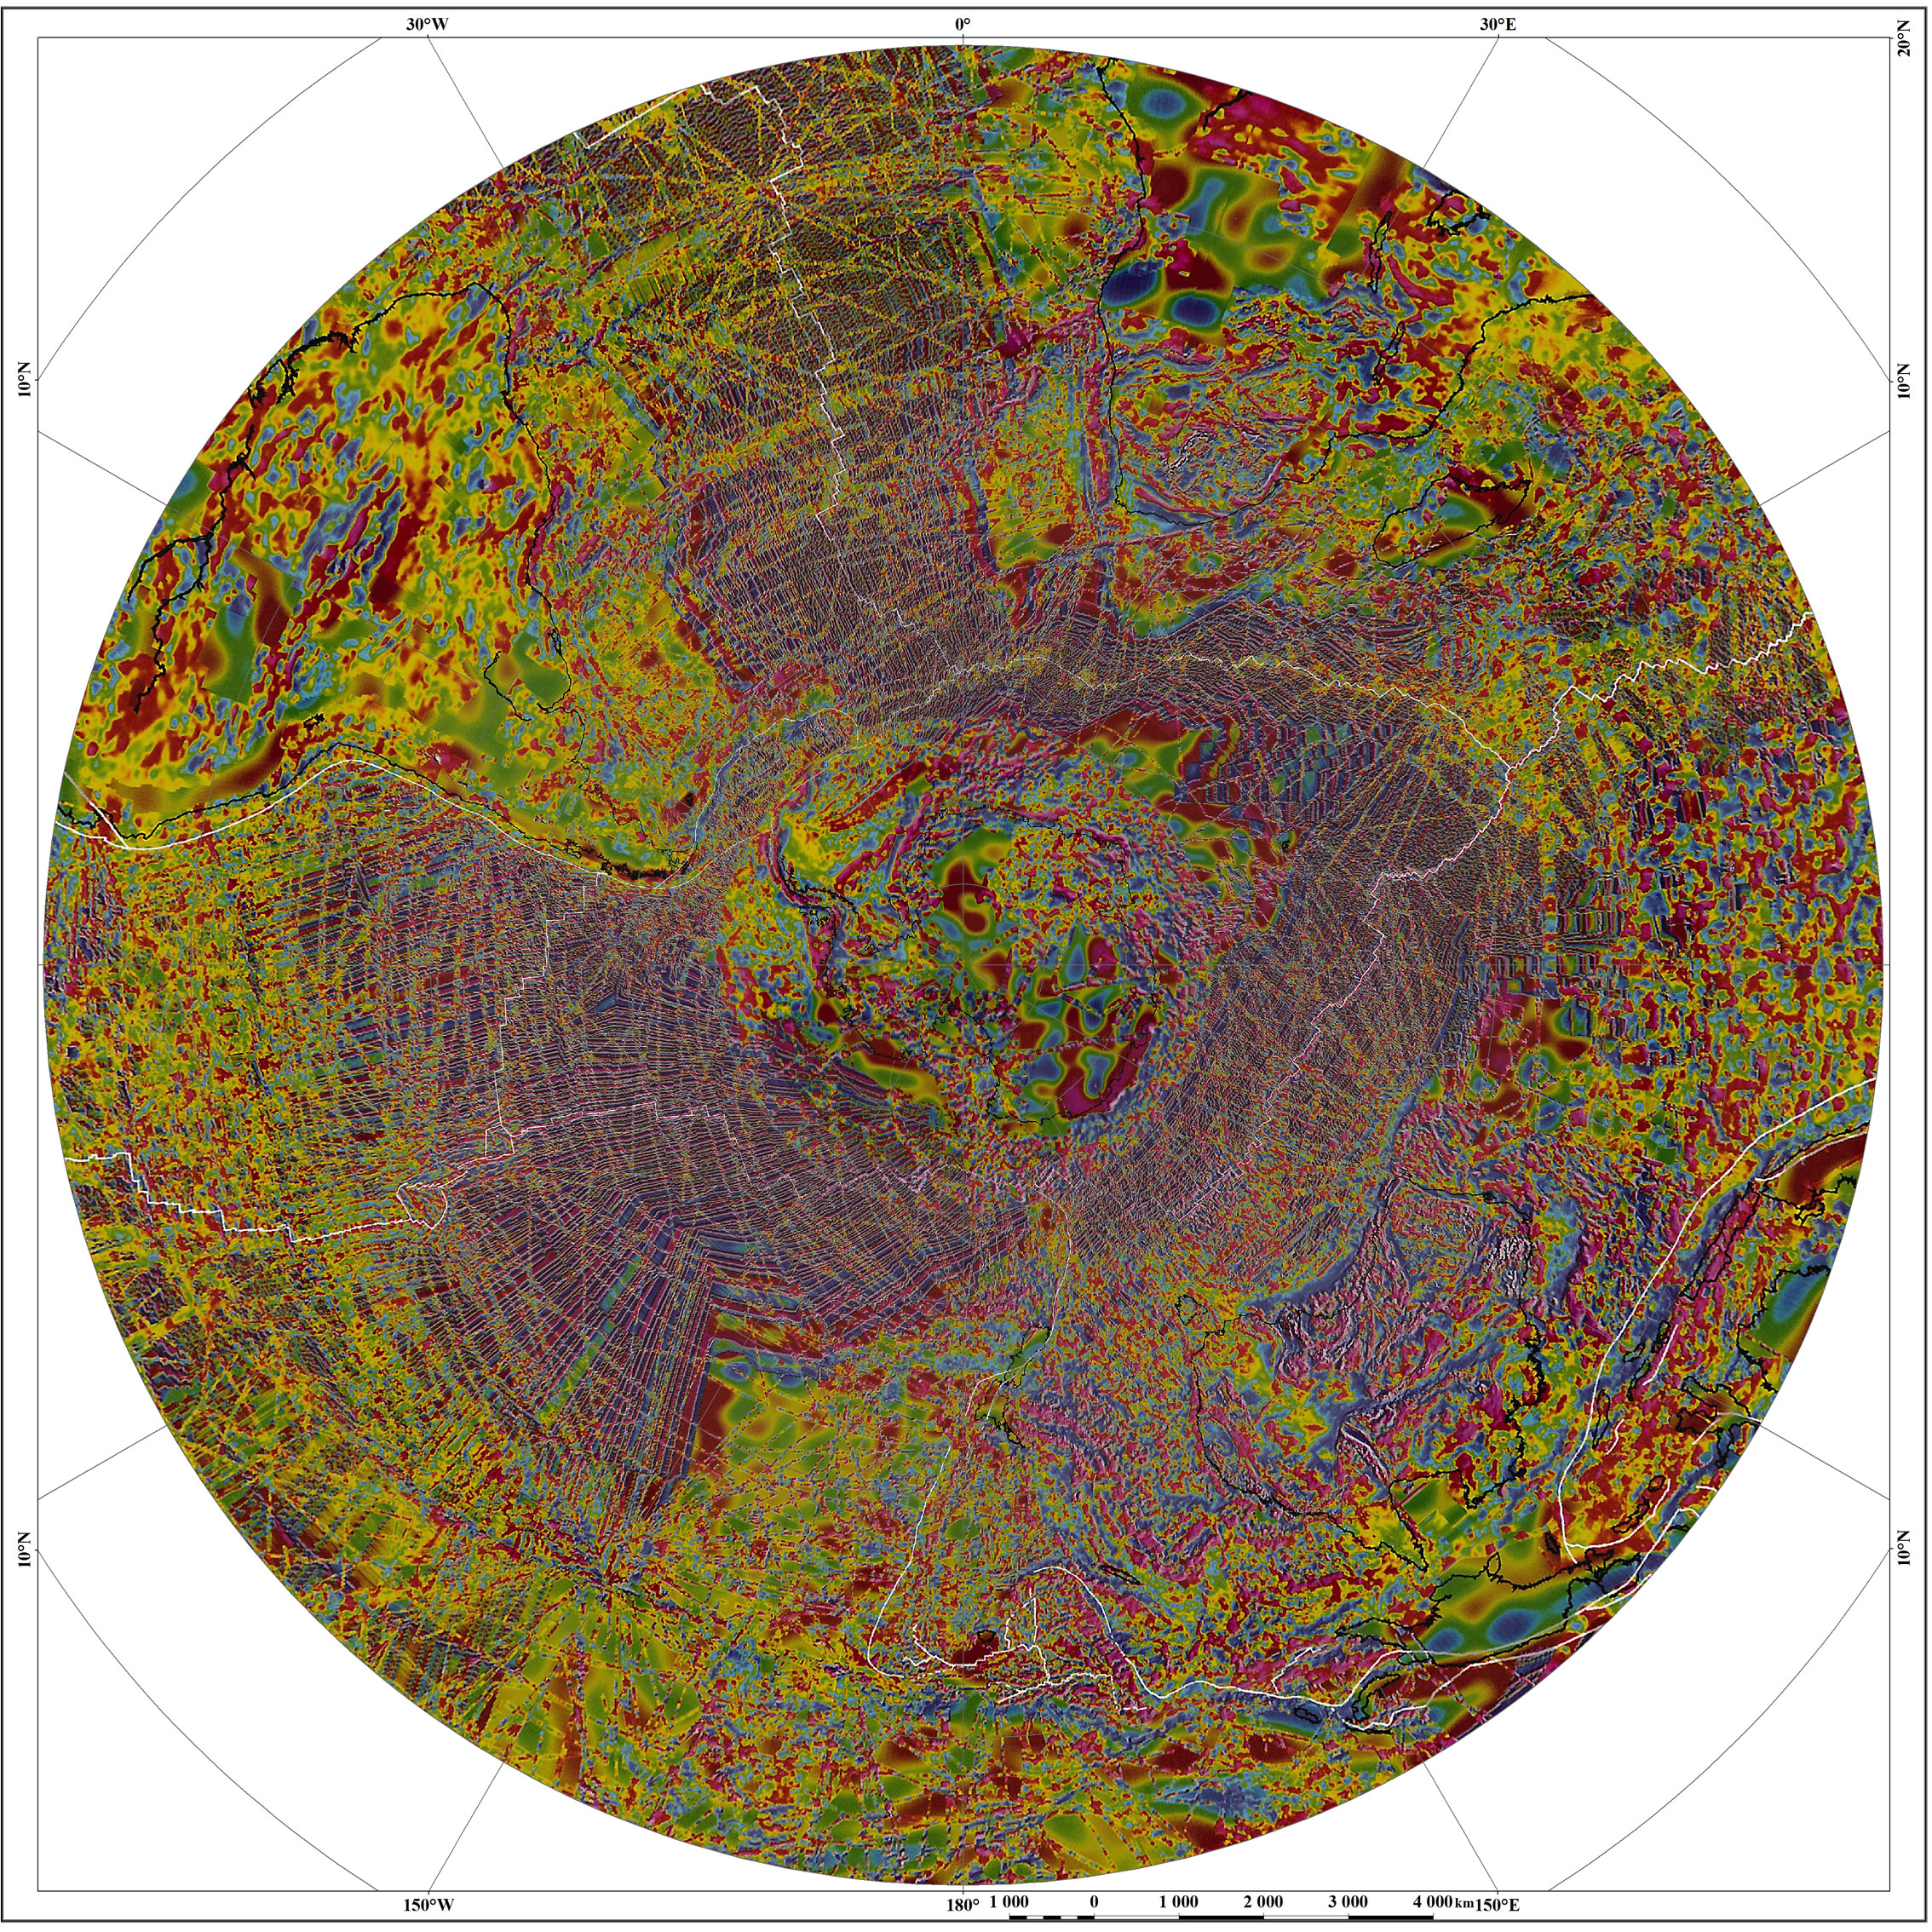
WORLD MAGNETIC ANOMALY MAP
The World Magnetic Anomaly Map at 1:50 000 000 scale (2007) was compiled under the aegis of IAGA (International Association of Geomagnetism and Aeronomy) and CGMW (Commission for the Geological Map of the World). The map integrates surface, aeromagnetic, marine and satellite data. The magnetic anomalies mostly fall under the 5 kilometer altitude level. The map has the resolution of 3'x3' and is graphically represented by images of magnetized bodies, whose values go up in red-yellow shades, and go down or even below 0 in bluish shades.
High resolution archive: Map of magnetic anomalies World; Map of magnetic anomalies North Hemisphere; Map of magnetic anomalies South Hemisphere
|
|
|
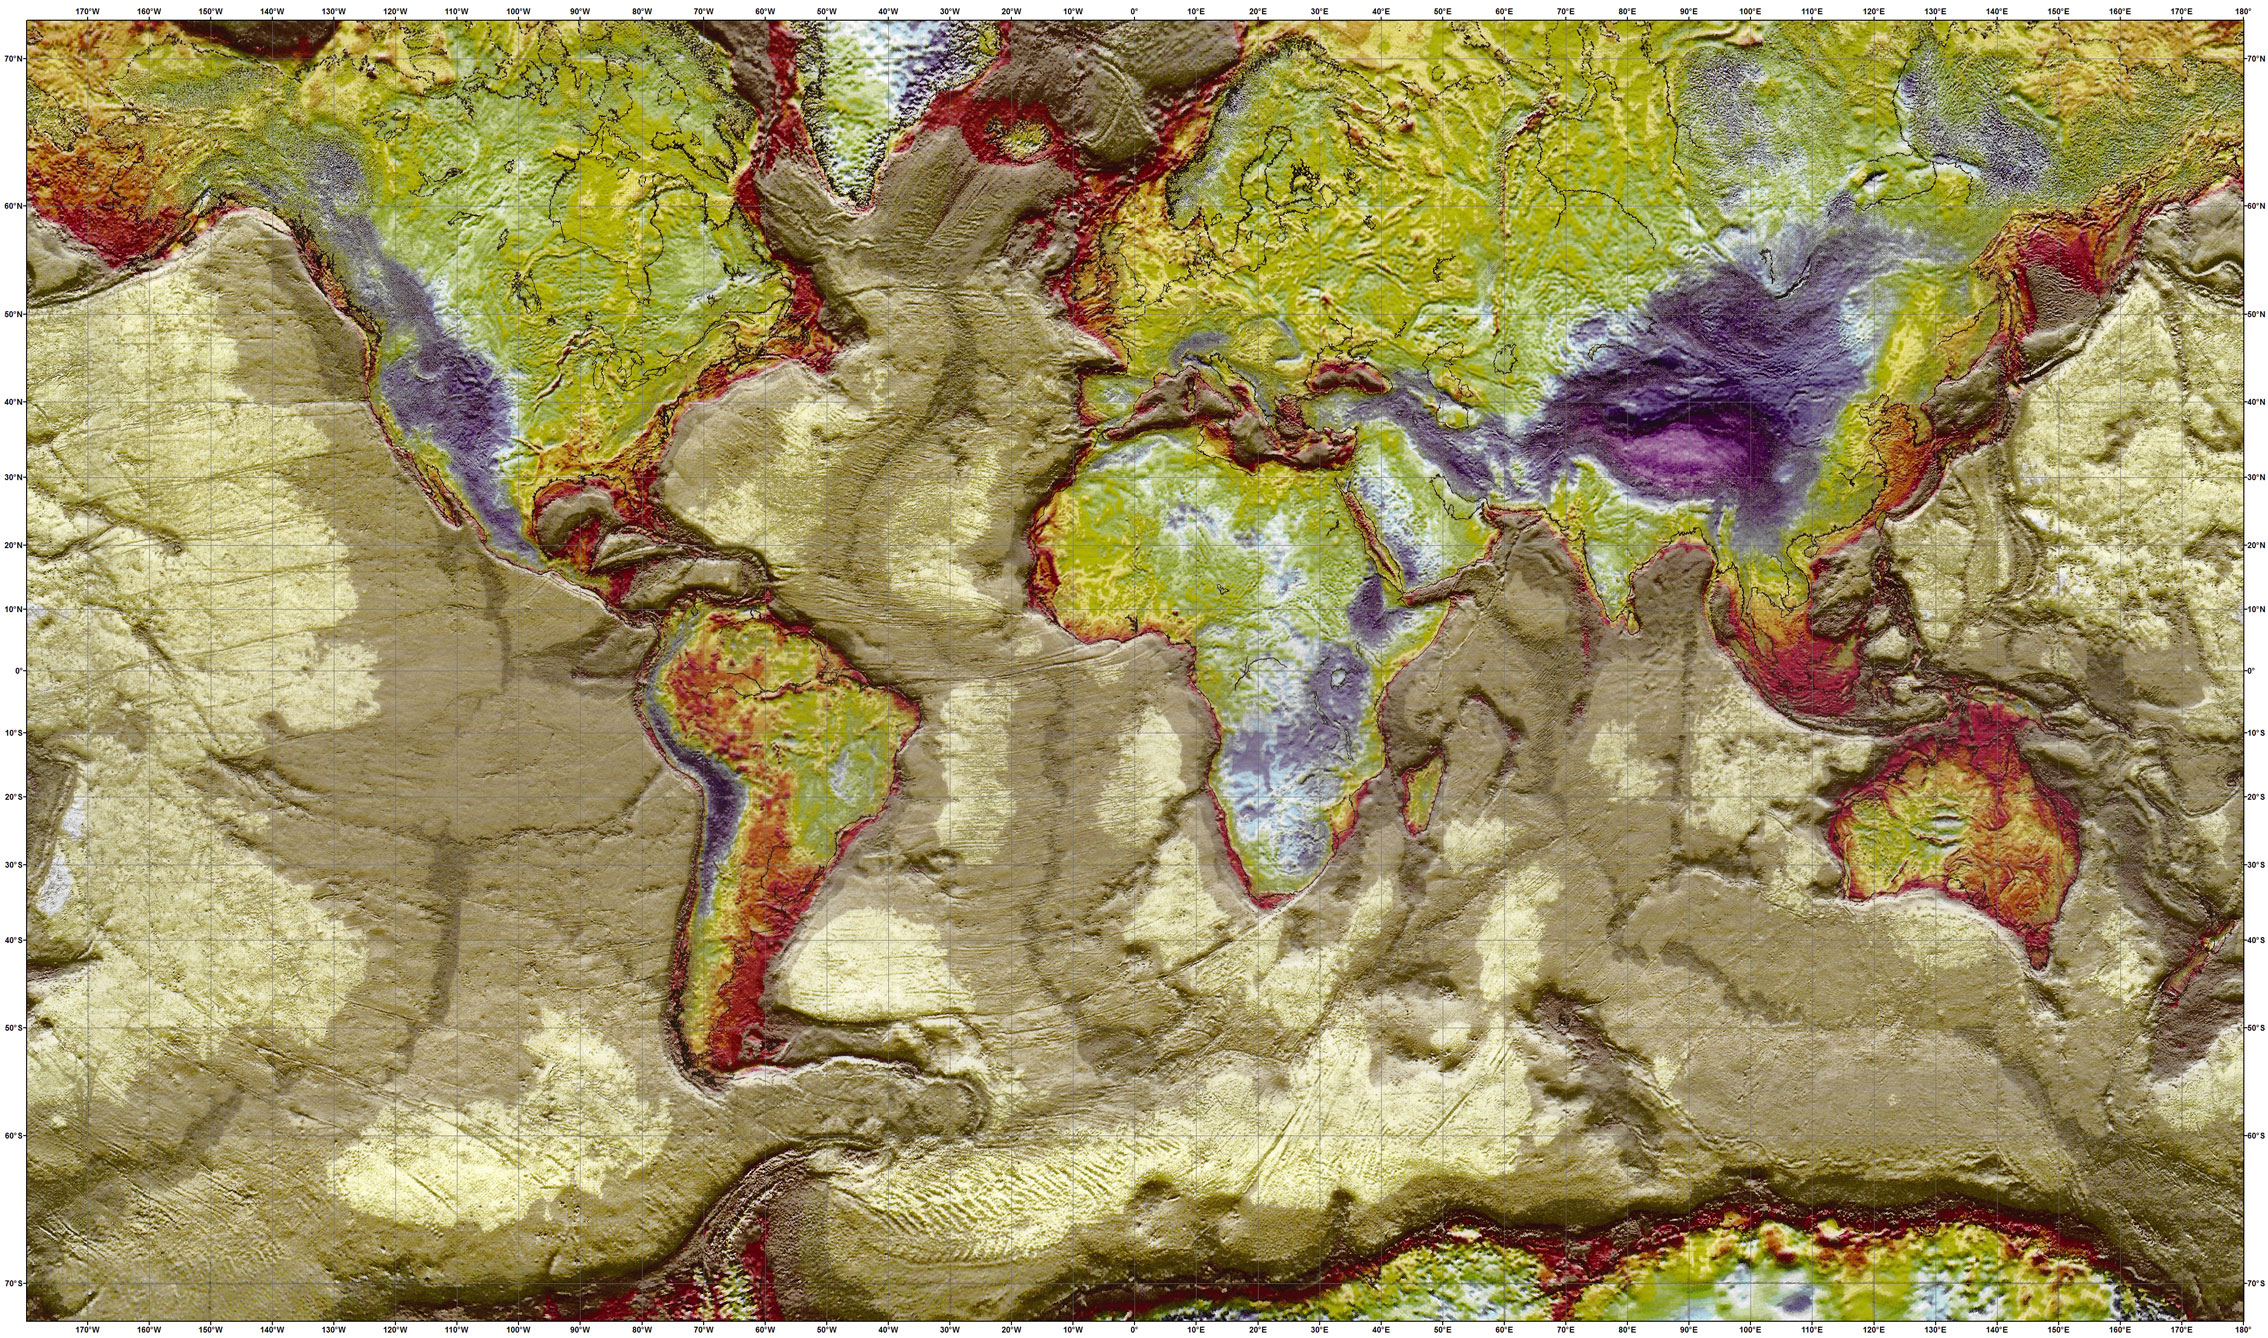
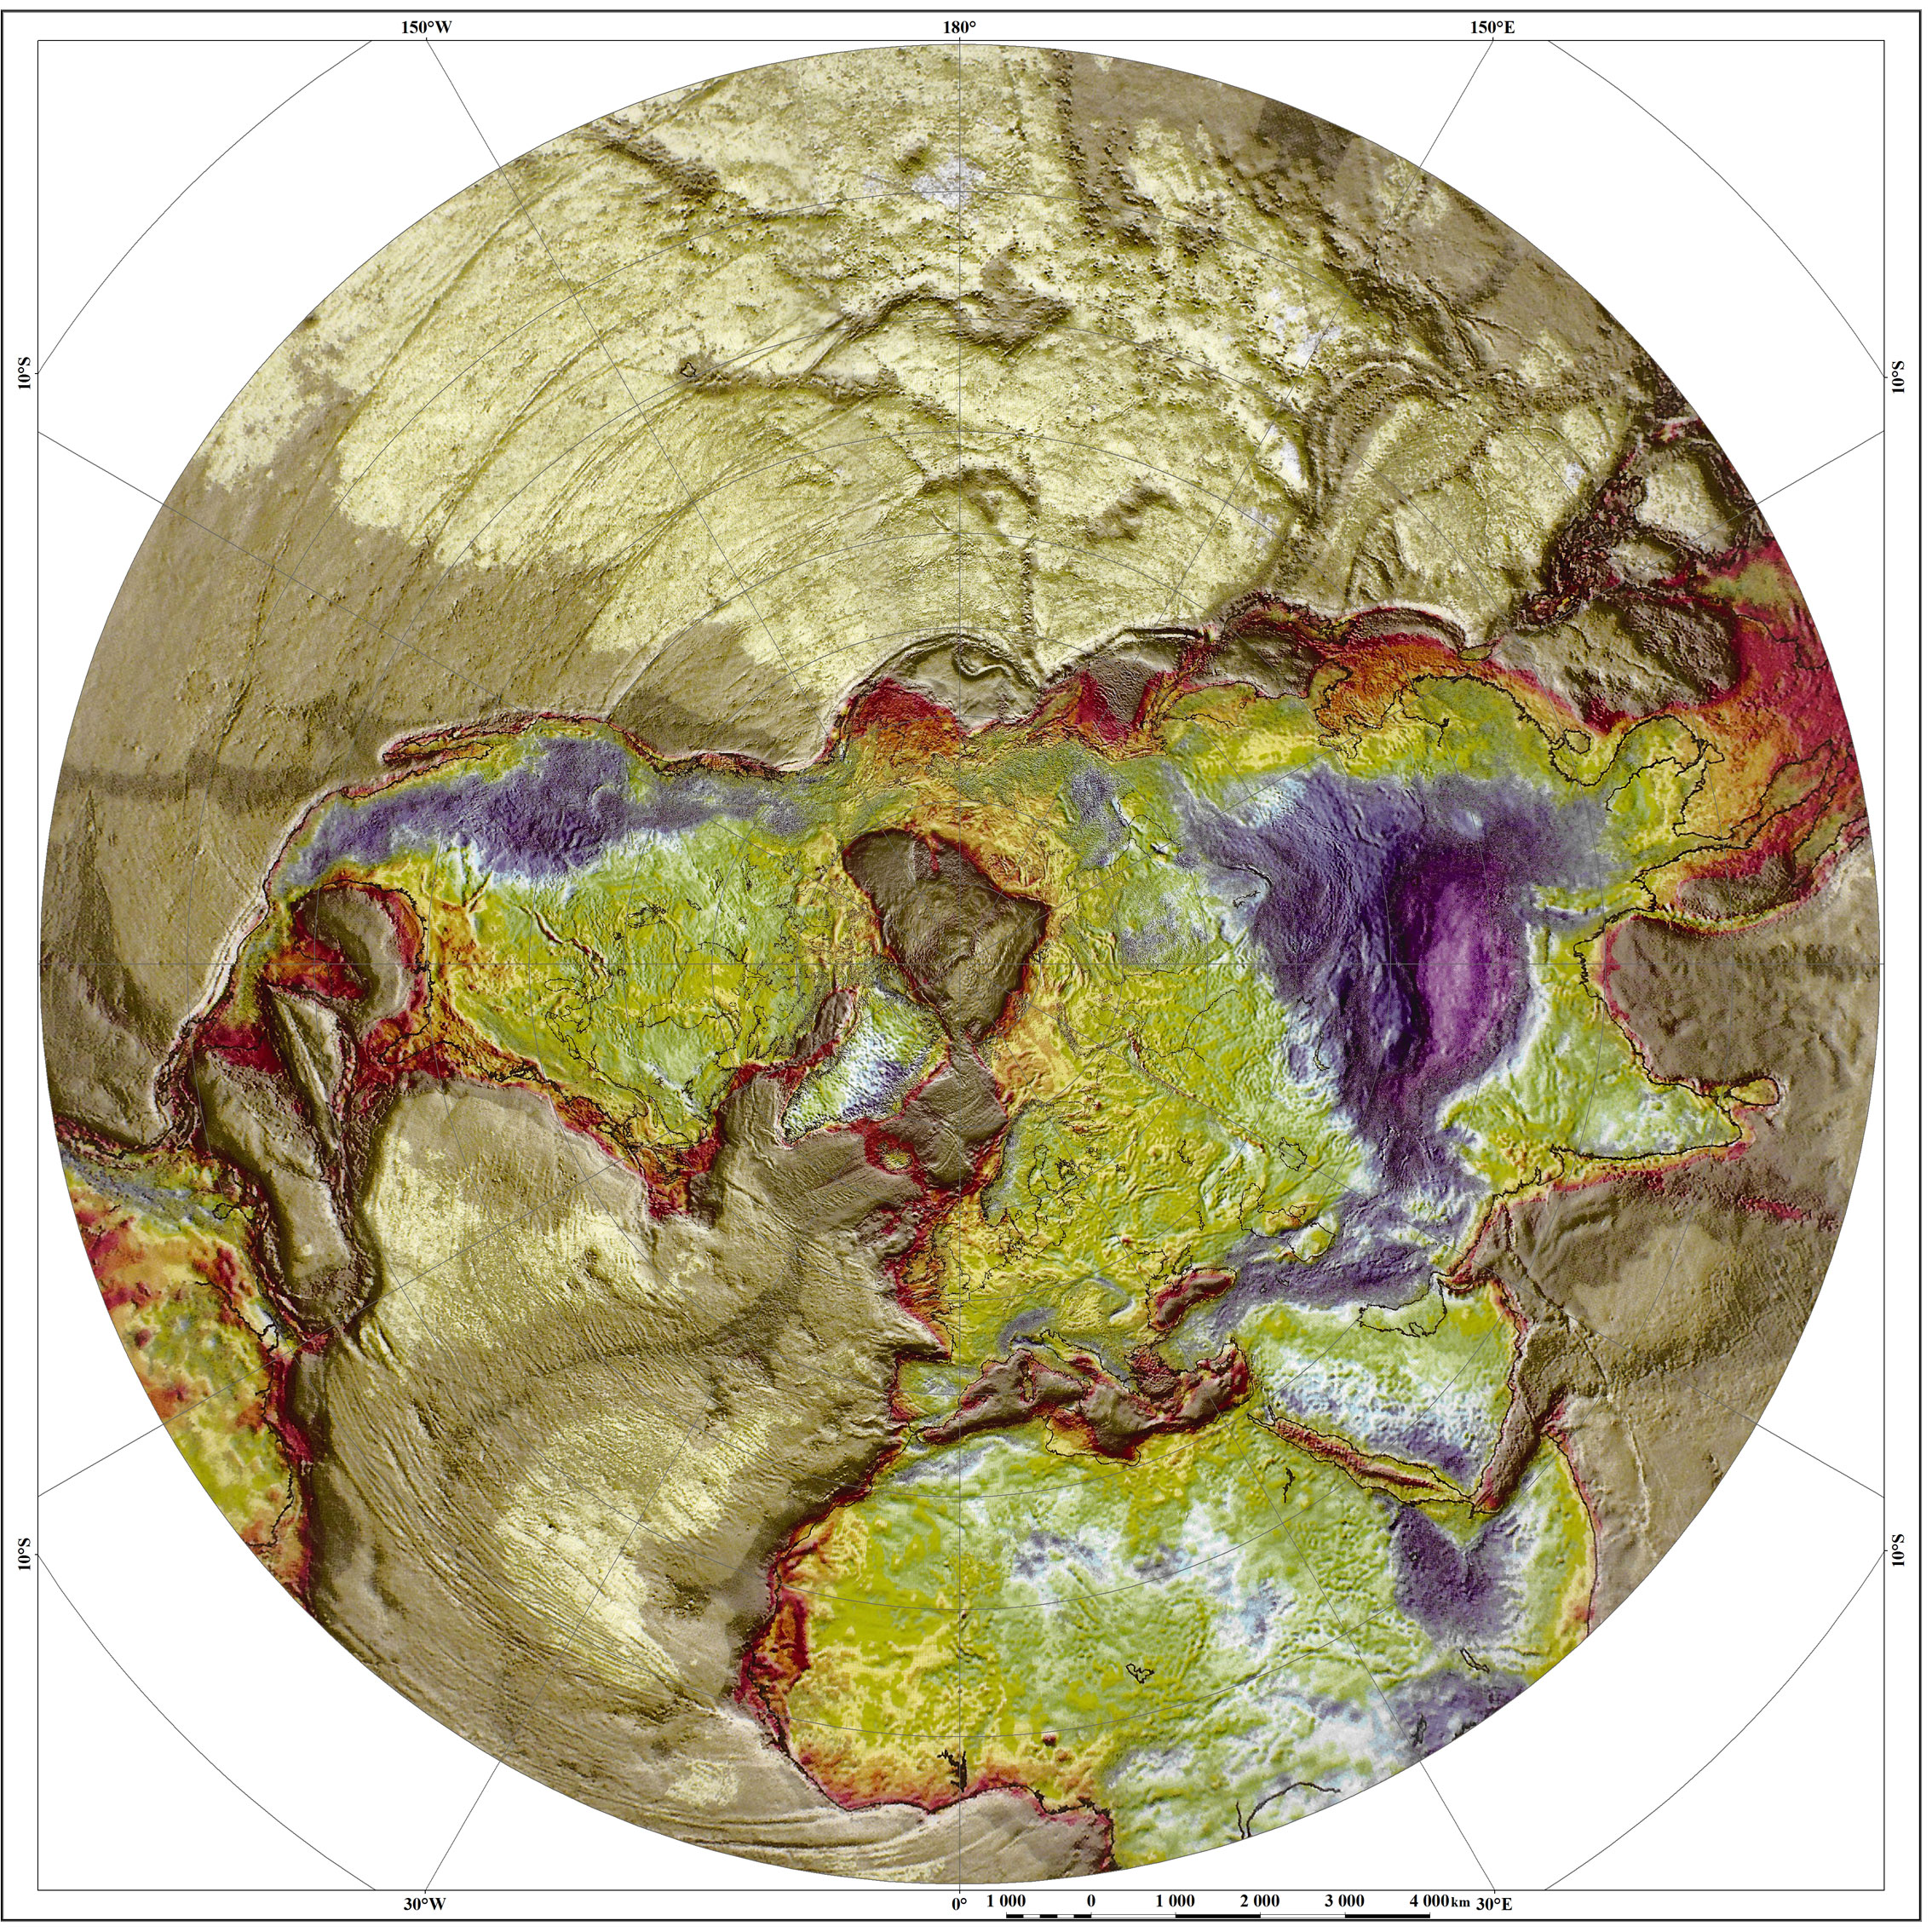
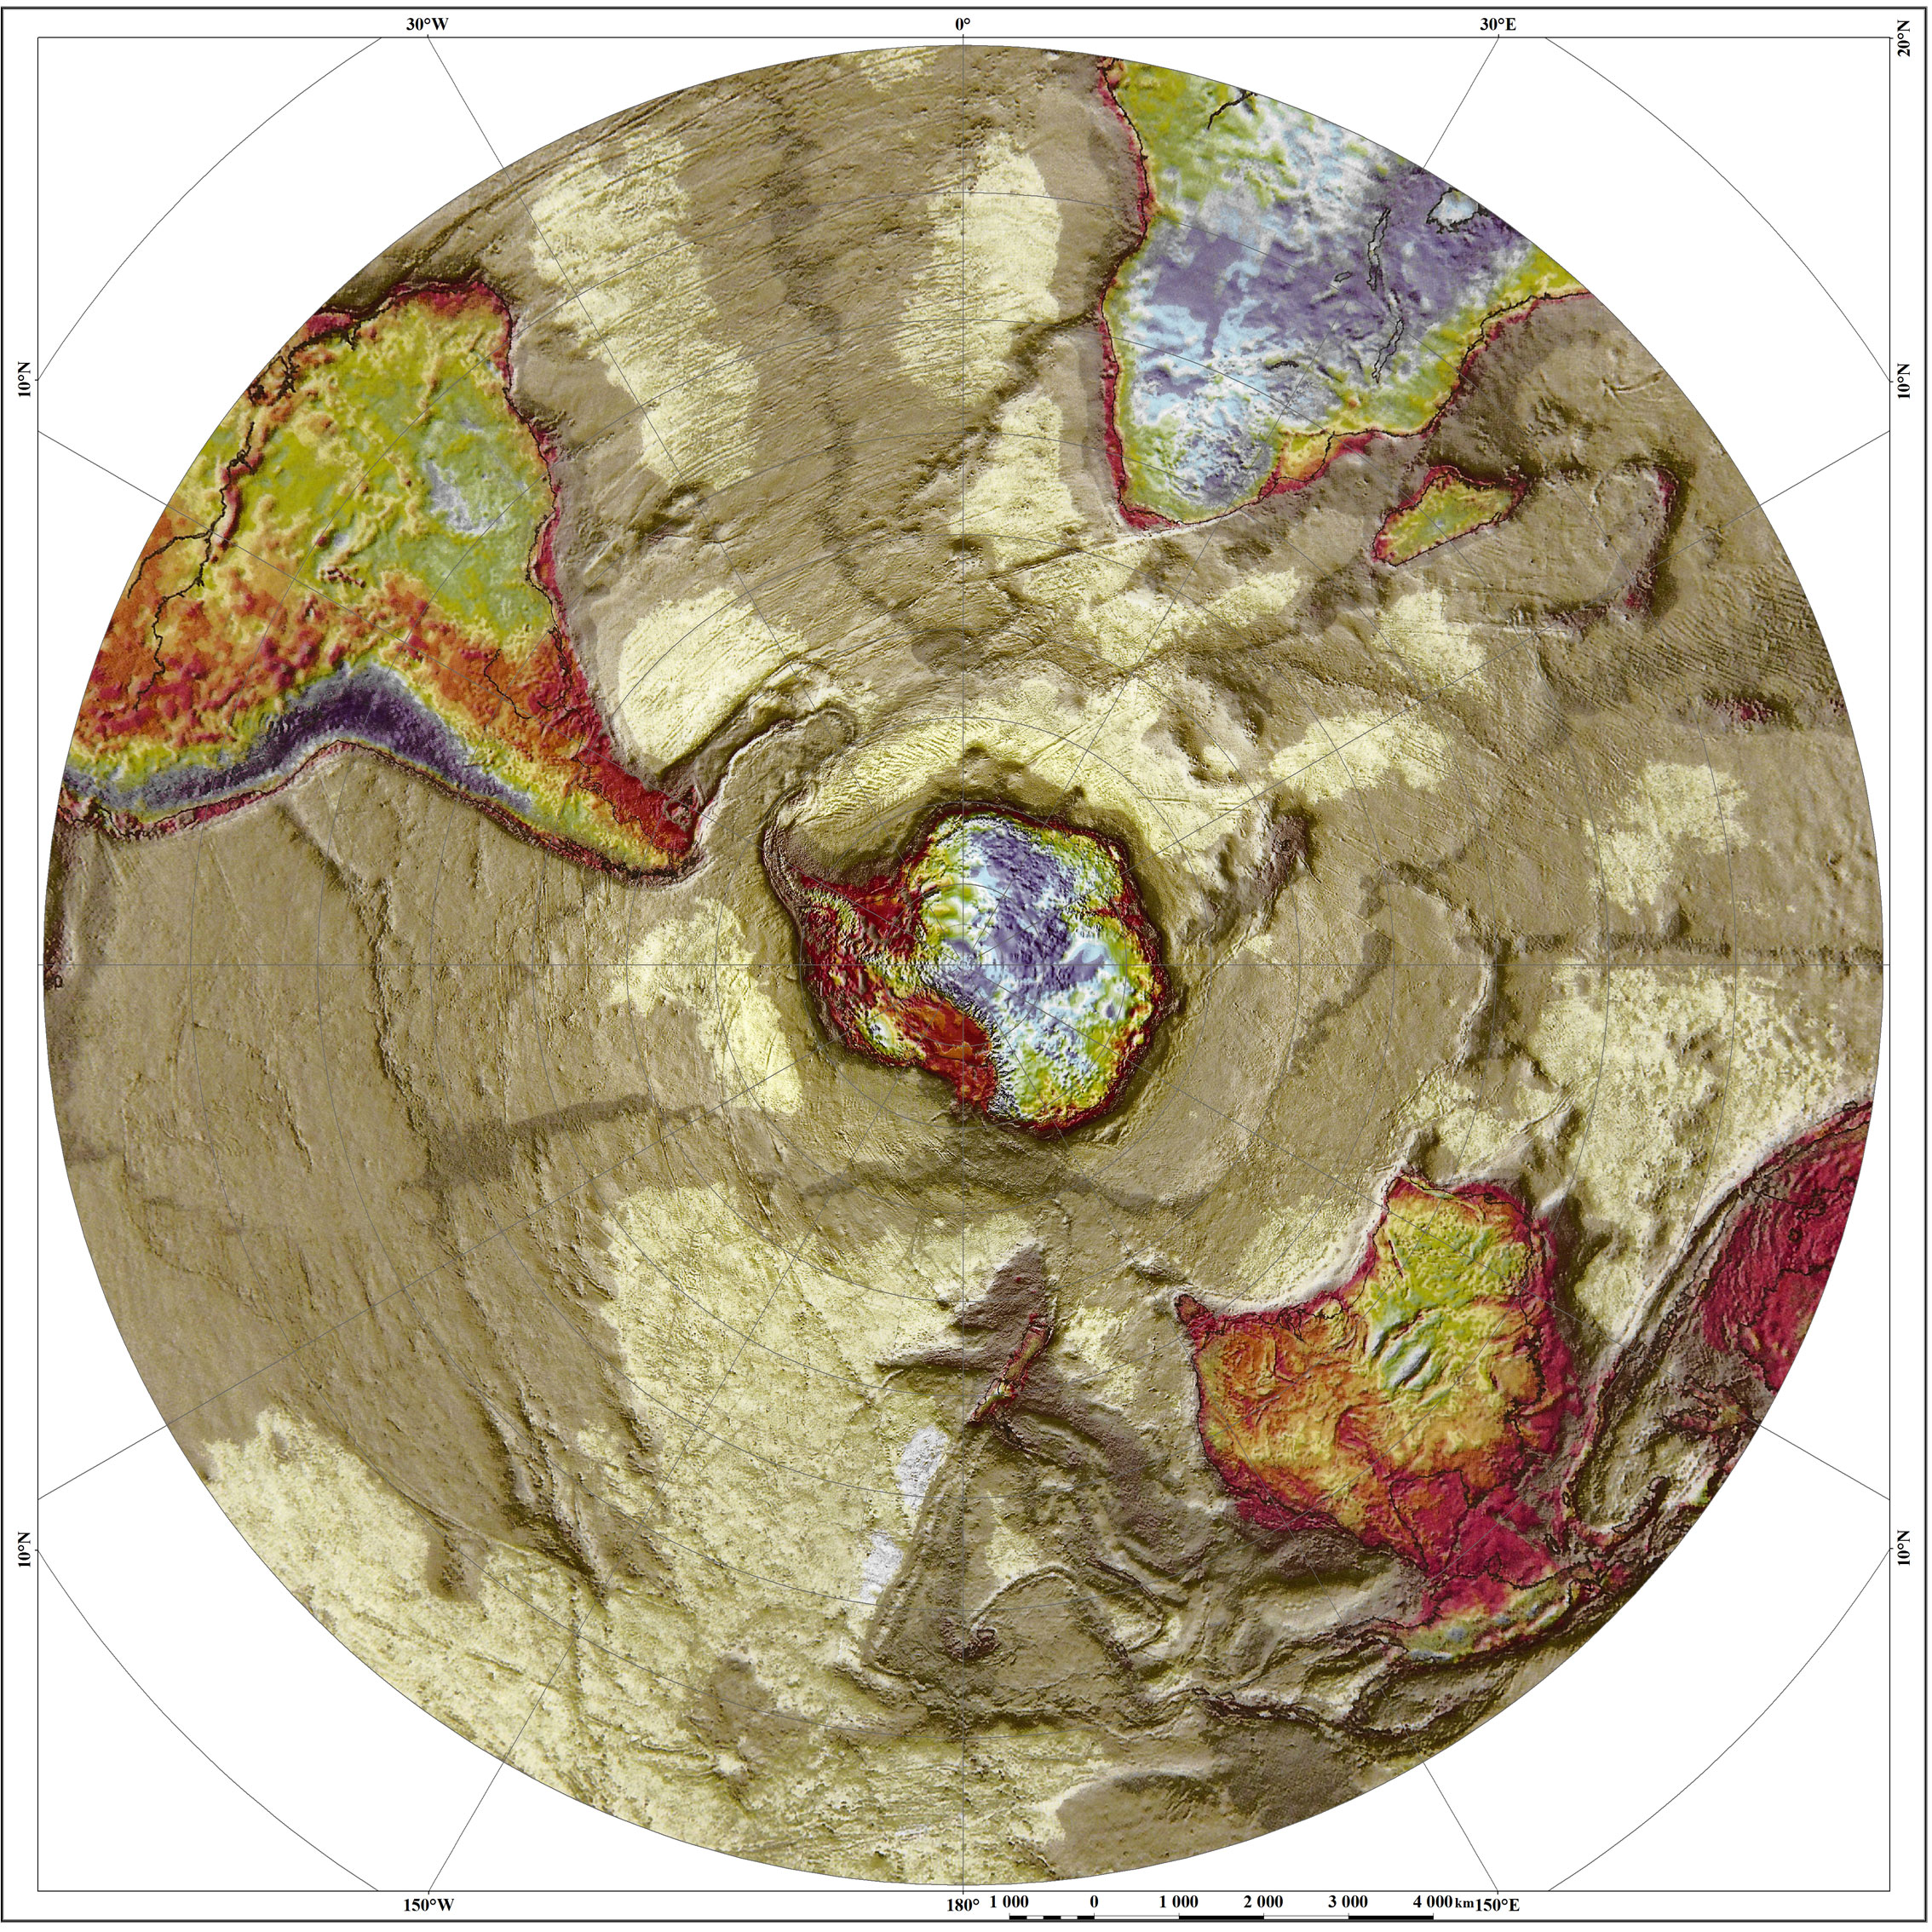
WORLD GRAVITY MAP
The World Gravity Map (WGM) at 1:50 000 000 scale (2012) was compiled by the International Gravimetric Bureau (BGI) in cooperation with such international organizations as the Commission for the Geological Map of the World (CGMW), UNESCO, International Association of Geodesy (IAG), International Union of Geodesy and Geophysics (IUGG), International Union of Geological Sciences (IUGS) and various academic institutions. The map was created in spherical geometry at 2'x2' resolution. This gravity map is represented in Bouguer anomalies with the consideration of the majority of surface masses (crystalline rock -2670 kg/m3, mantle rocks - 3270 kg/m3, oceans - 1027 kg/m3, inland seas and lakes - 1000 kg/m3, ice caps and shelf glaciers - 917 kg/m3).
High resolution archive: Map of gravity anomalies World; Map of gravity anomalies North Hemisphere; Map of gravity anomalies South Hemisphere
|
|
MAPS OF DEEP STRUCTURE
The maps of deep structure are based on data provided by the global crustal model CRUST1.0 (Gabi Laske, Guy Masters, Zhitu Ma, and Mike Pasyanos) found at https://github.com/jrleeman/Crust1.0. The model with 1°×1° grid depicts absolute formation levels for main Earth’s crust division: relief, water, sediments, upper crust, middle crust, lower crust.
|
|
|
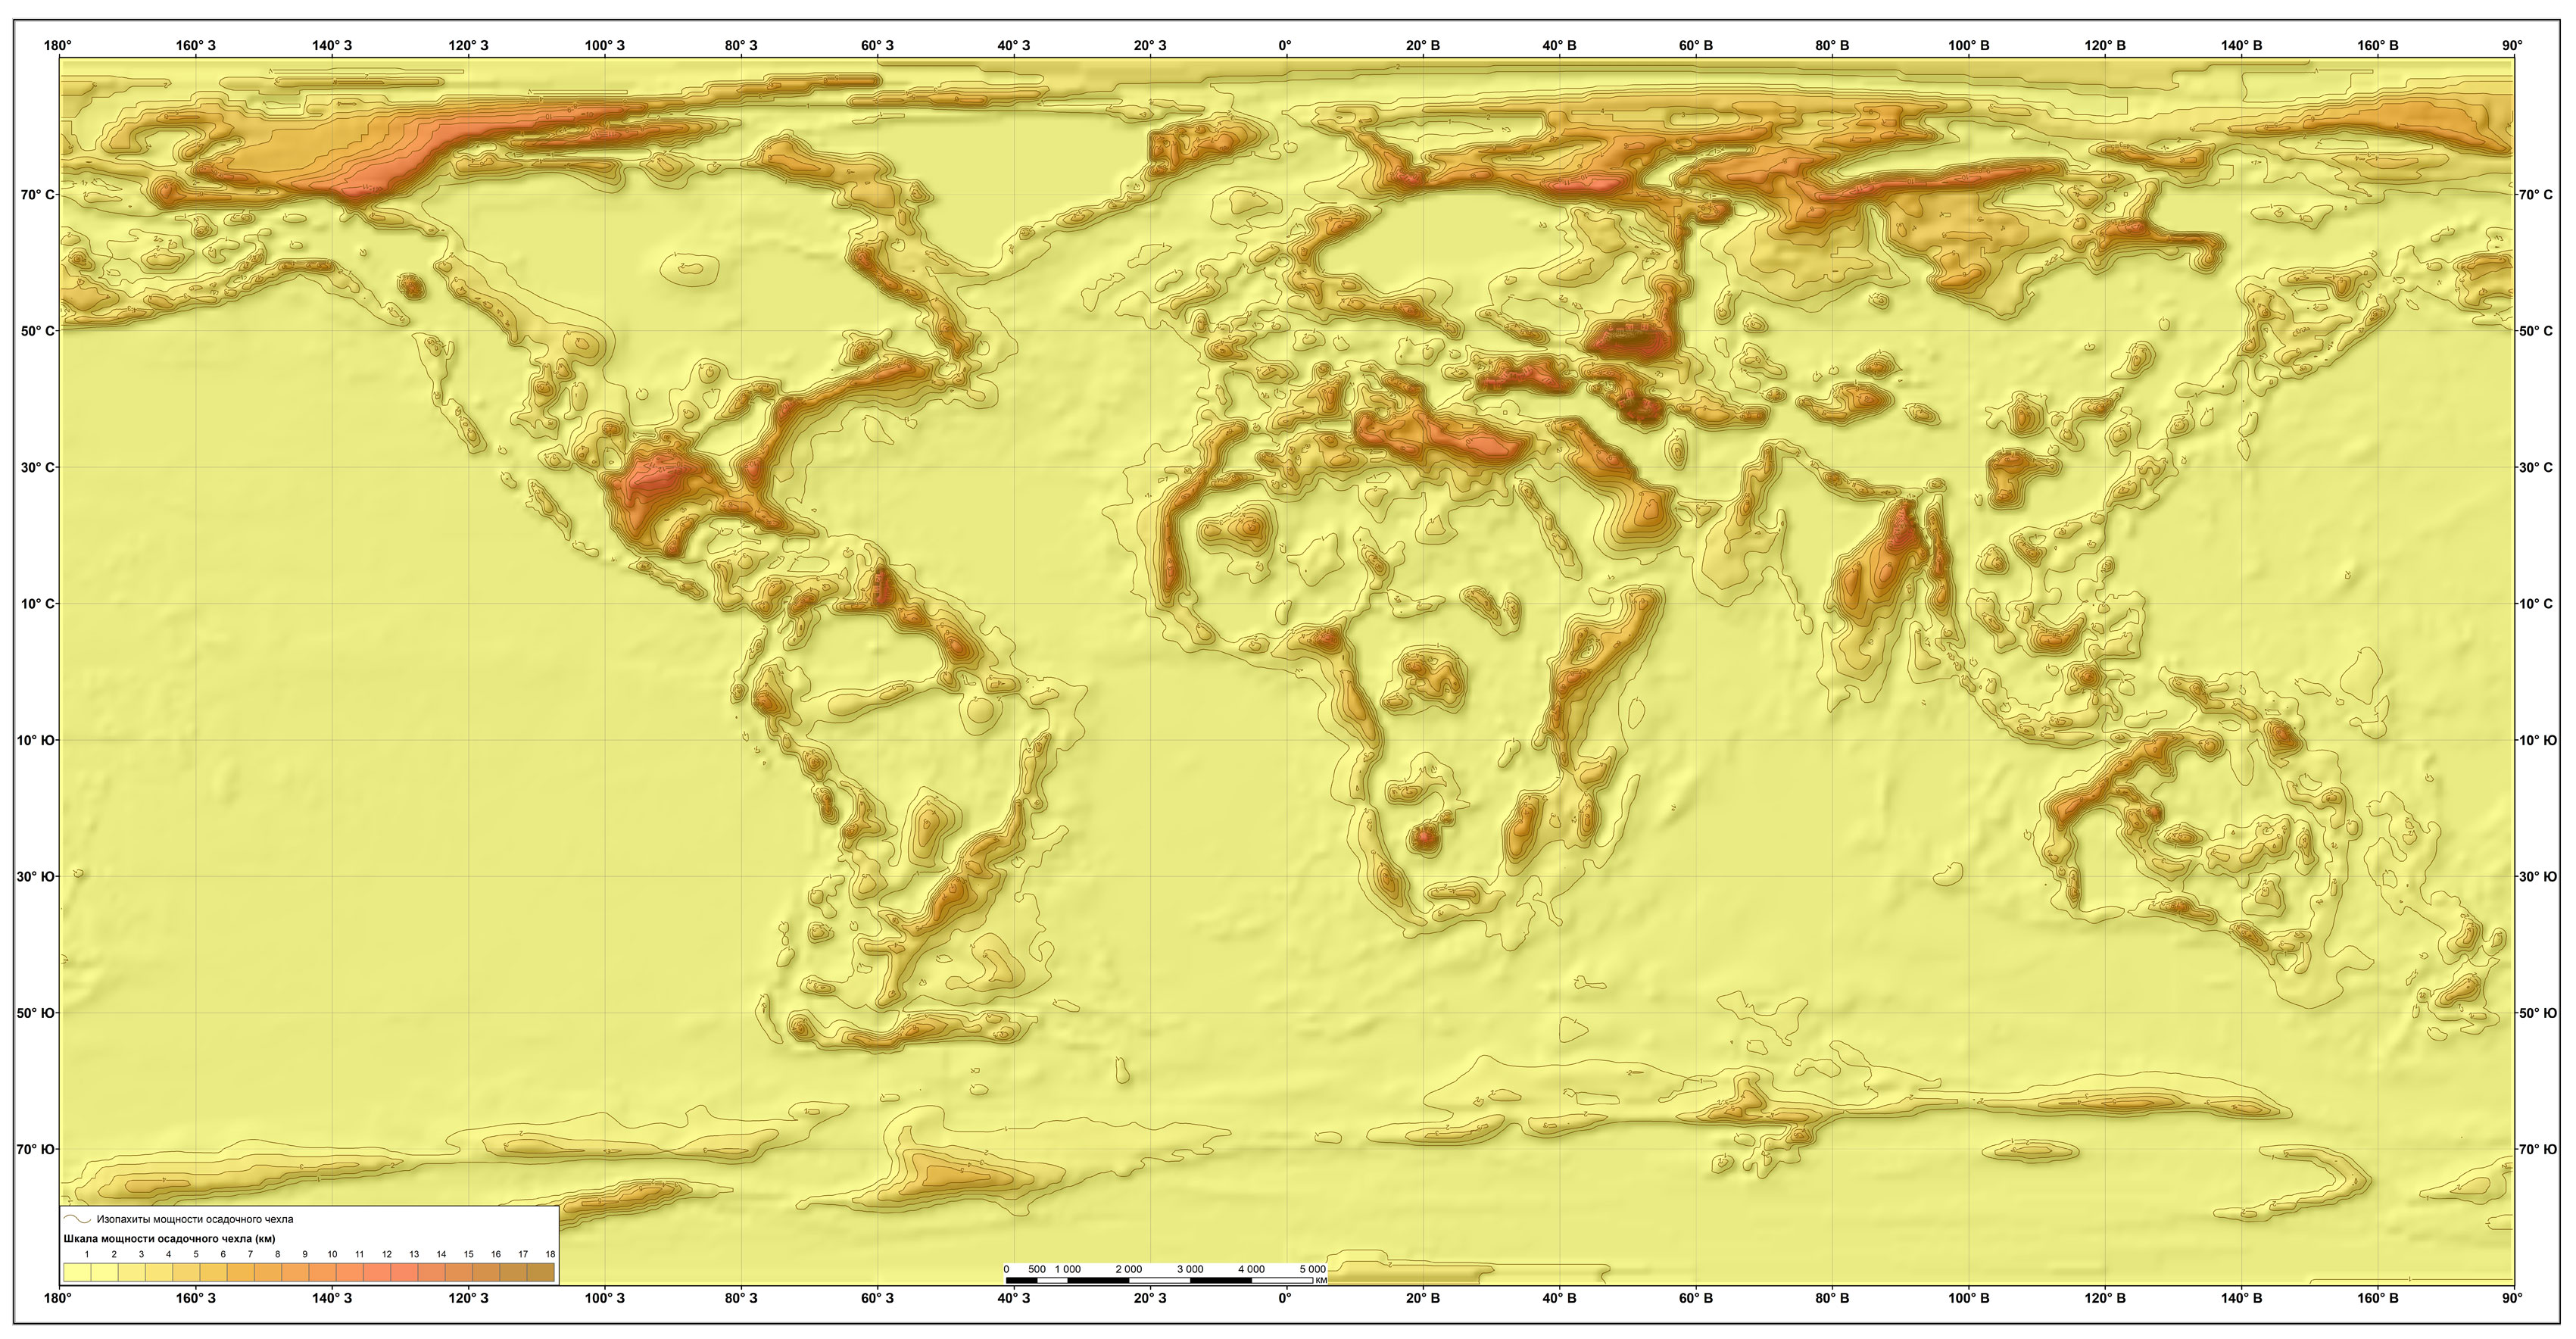
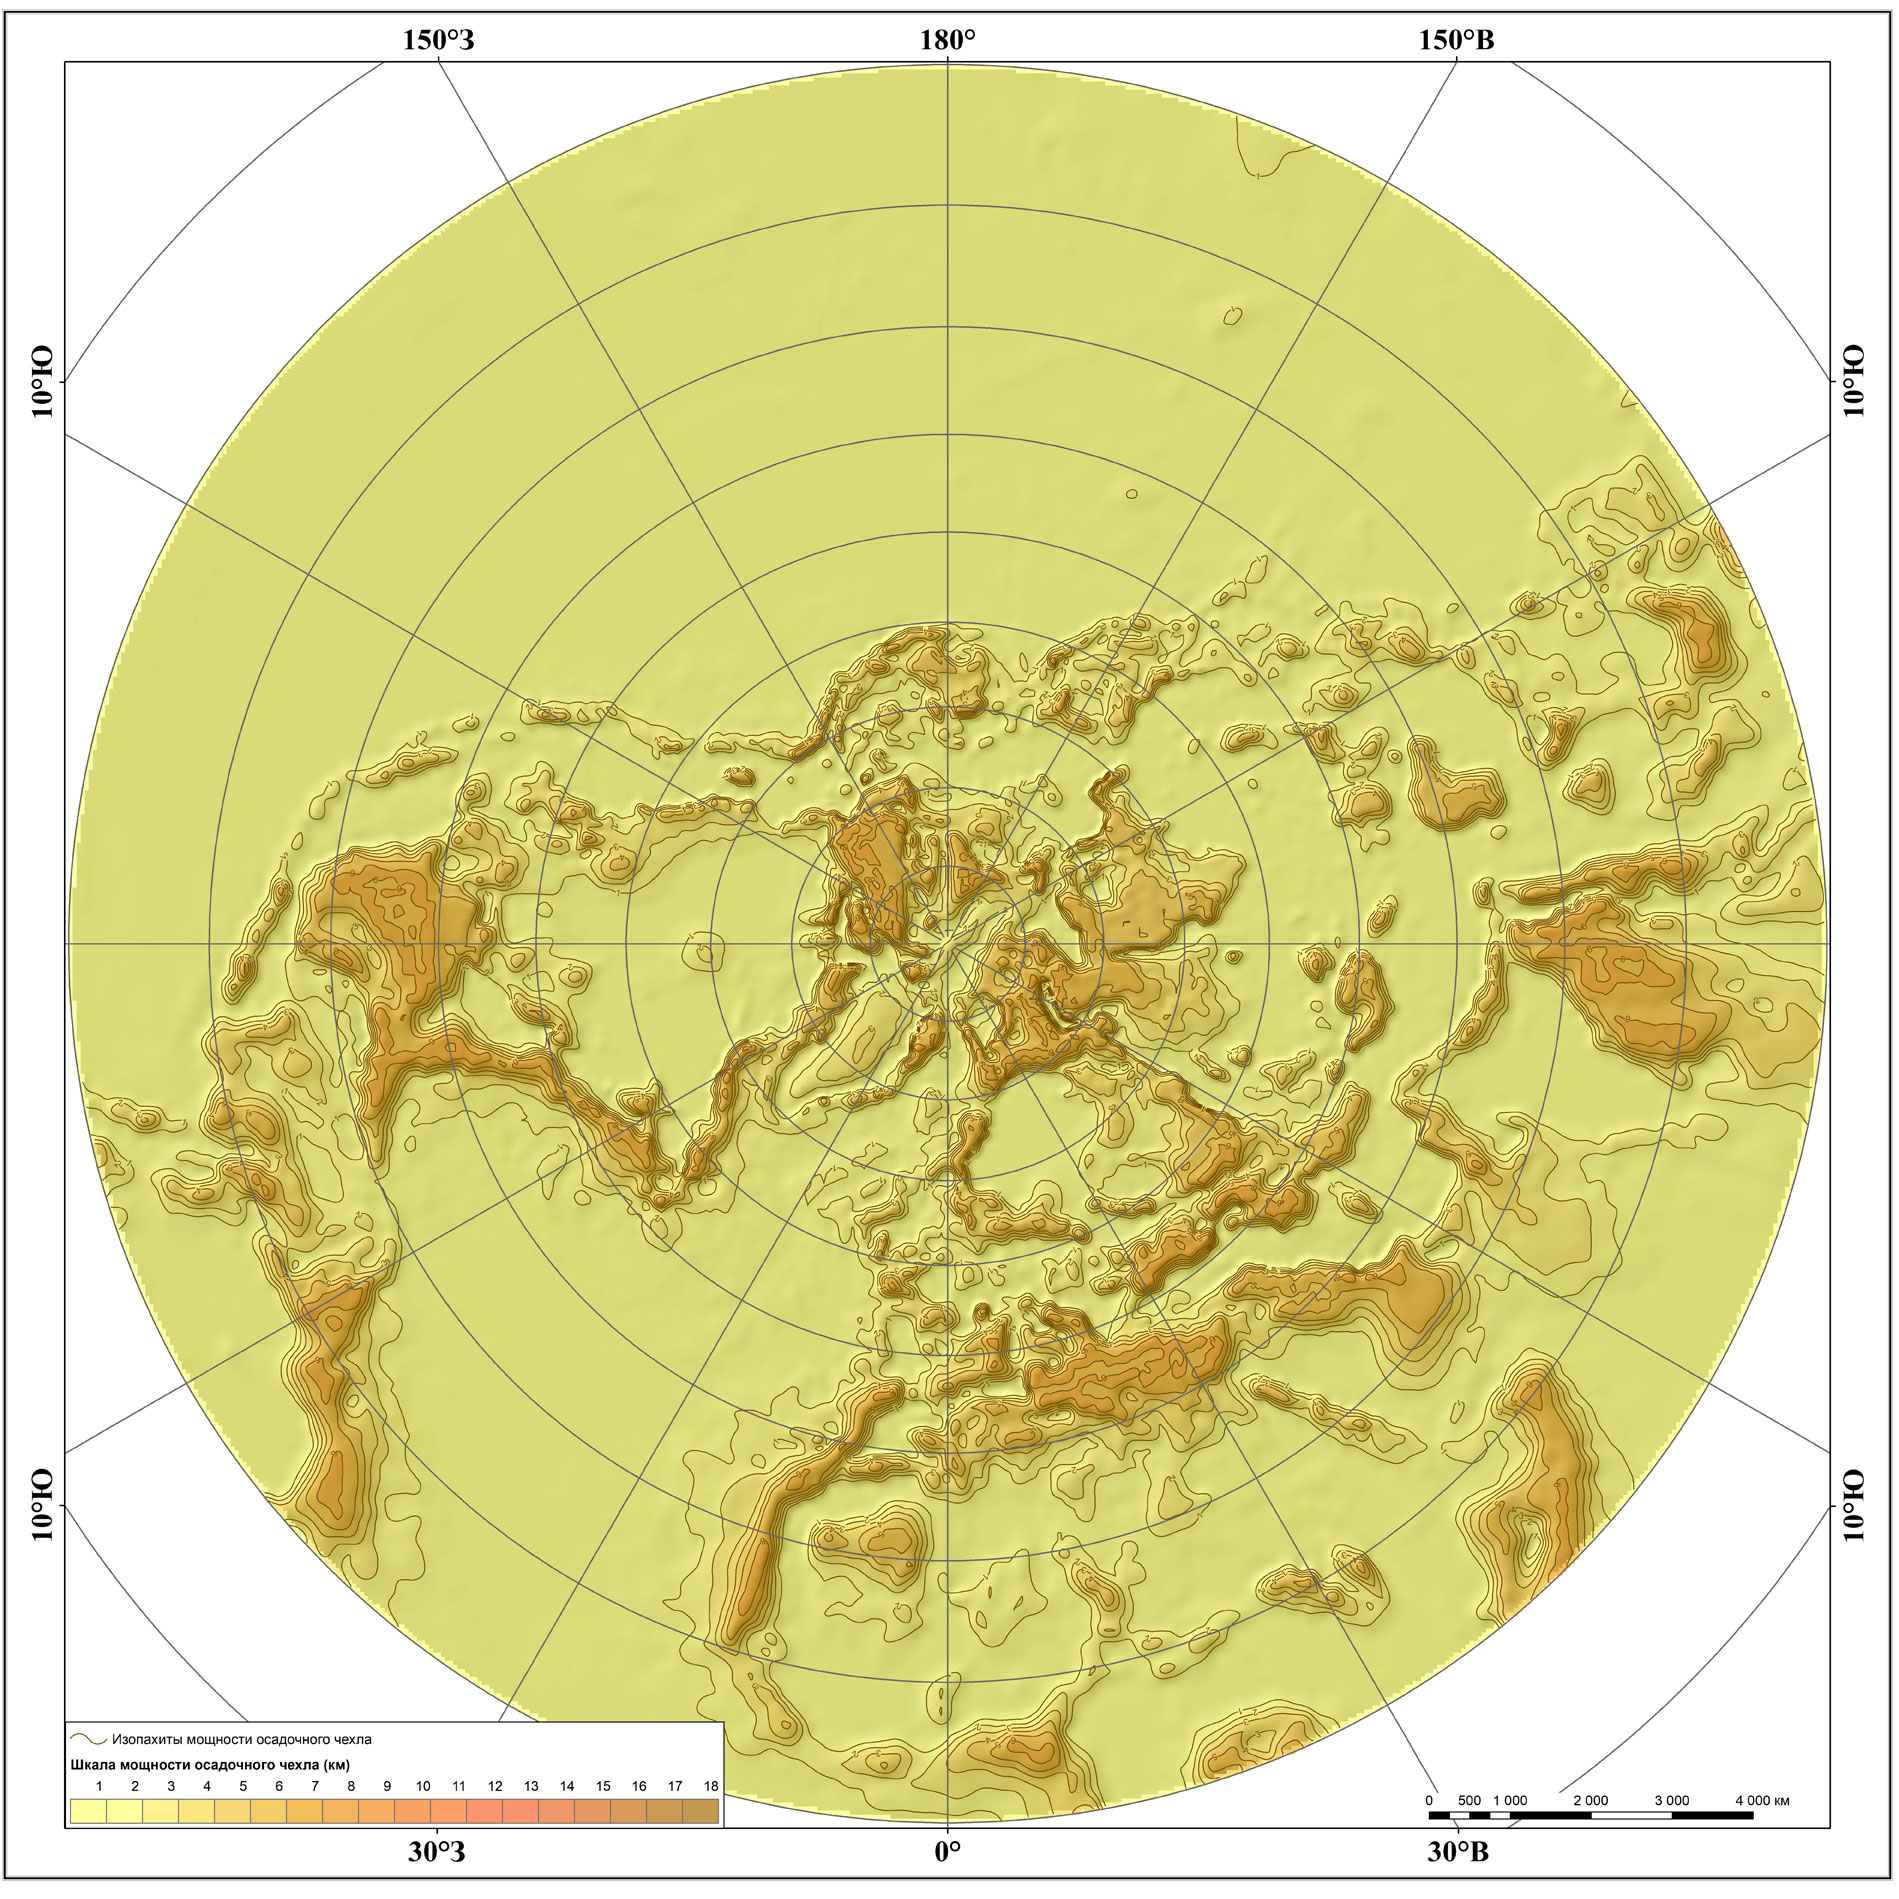
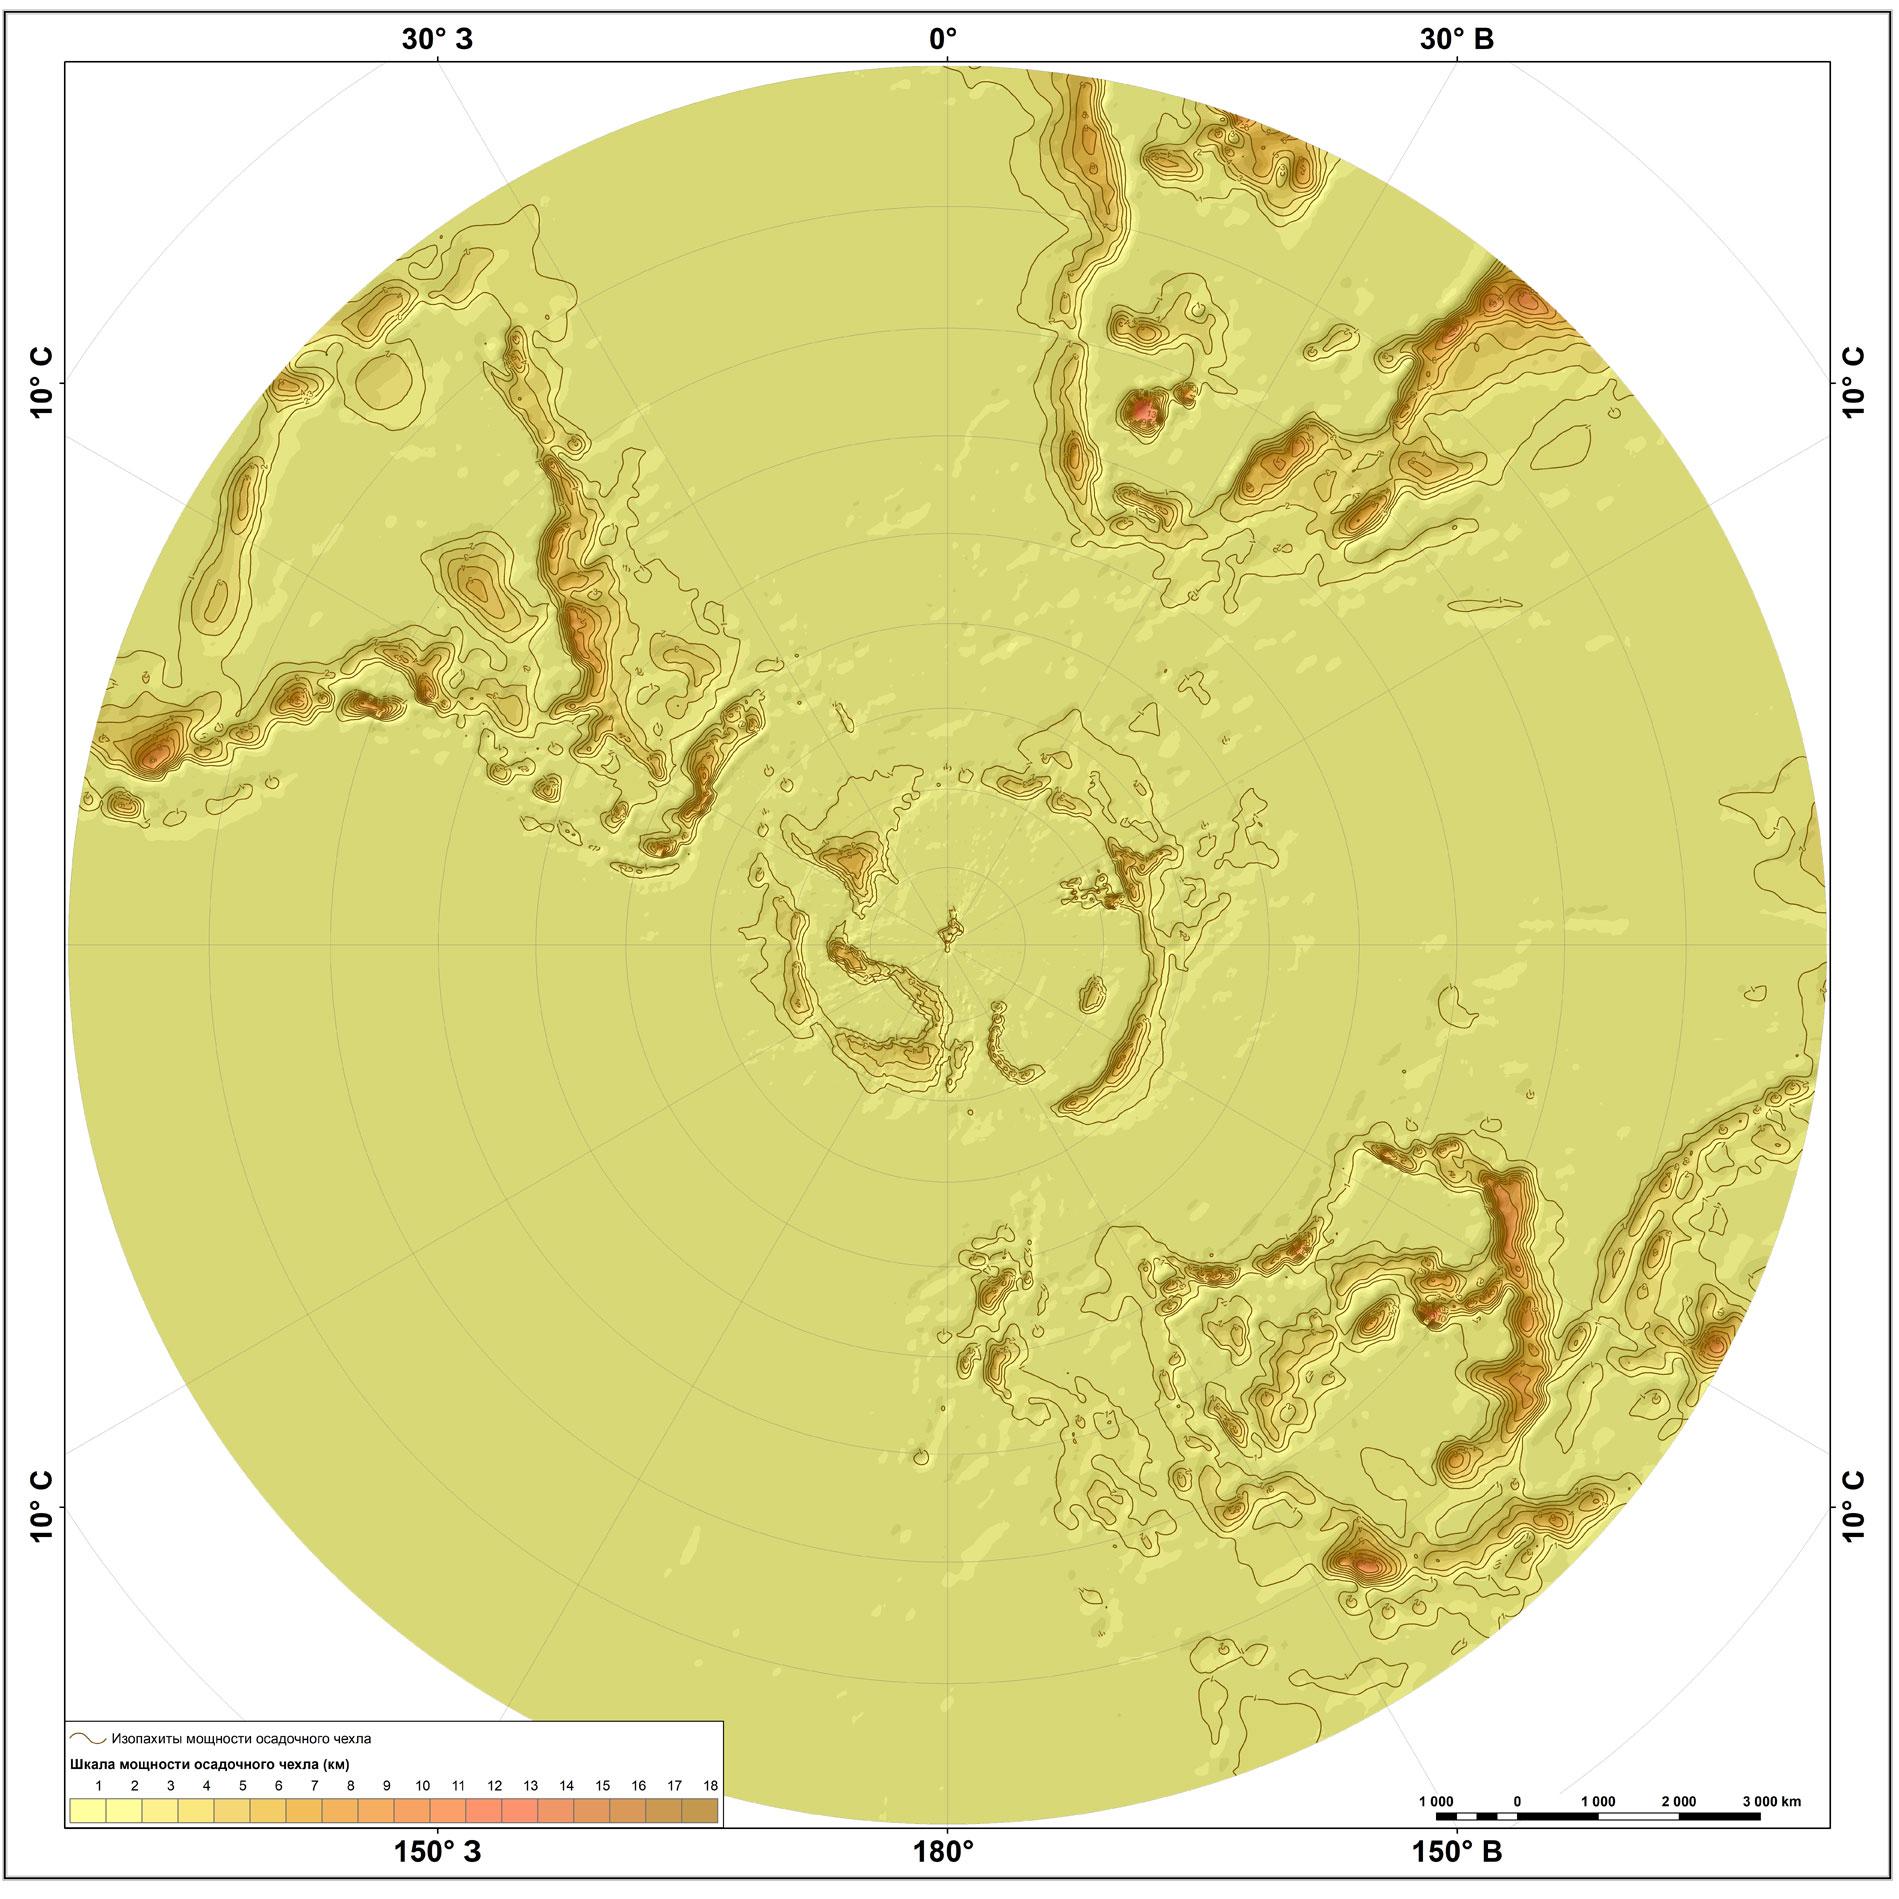
MAP OF THE SEDIMENTARY COVER THICKNESS
The global crustal model CRUST1.0 was used to calculate the thickness of the sedimentary cover.
To build the maps of the sedimentary cover thickness for the Northern and Southern Hemispheres, the point data have been recalculated in corresponding projections used to carry out estimations of digital matrixes with 50x50 km grid; 0.5°×0.5° grid was used to calculate the digital matrix of the world map. The resulting matrixes were used to calculate isopachs of the sedimentary cover at 1 km intervals.
High resolution archive: Sedimentary cover thickness World; Sedimentary cover thickness North Hemisphere; Sedimentary cover thickness South Hemisphere
|
|
|
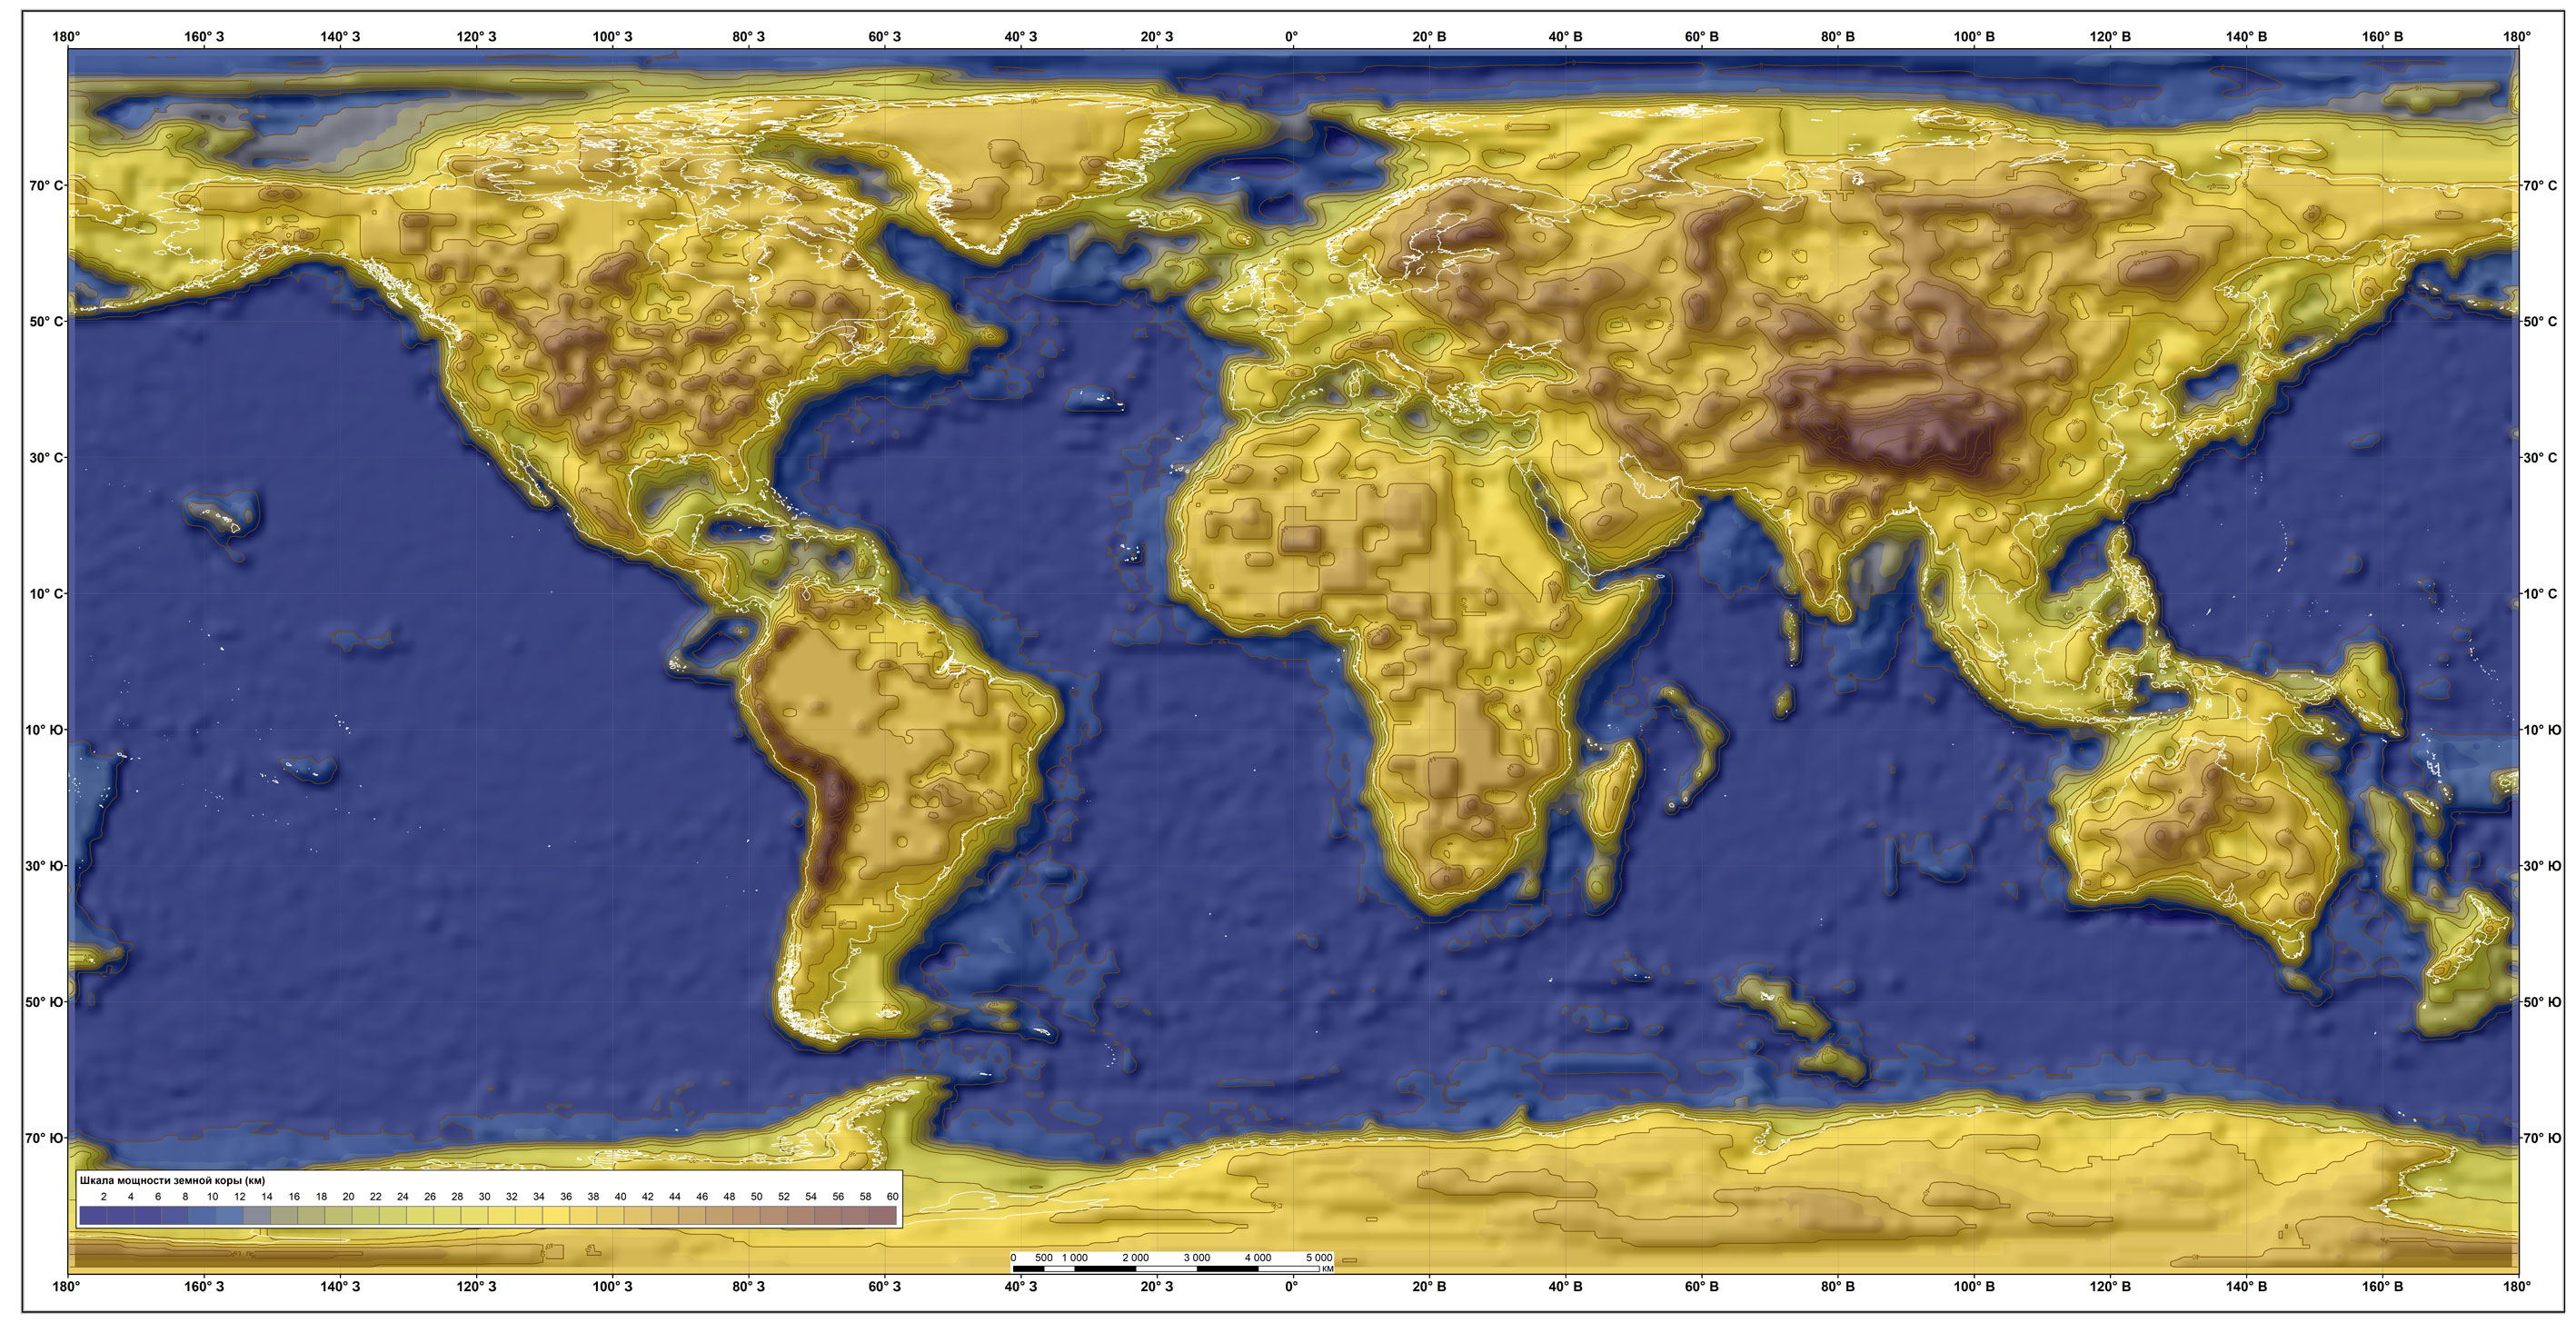
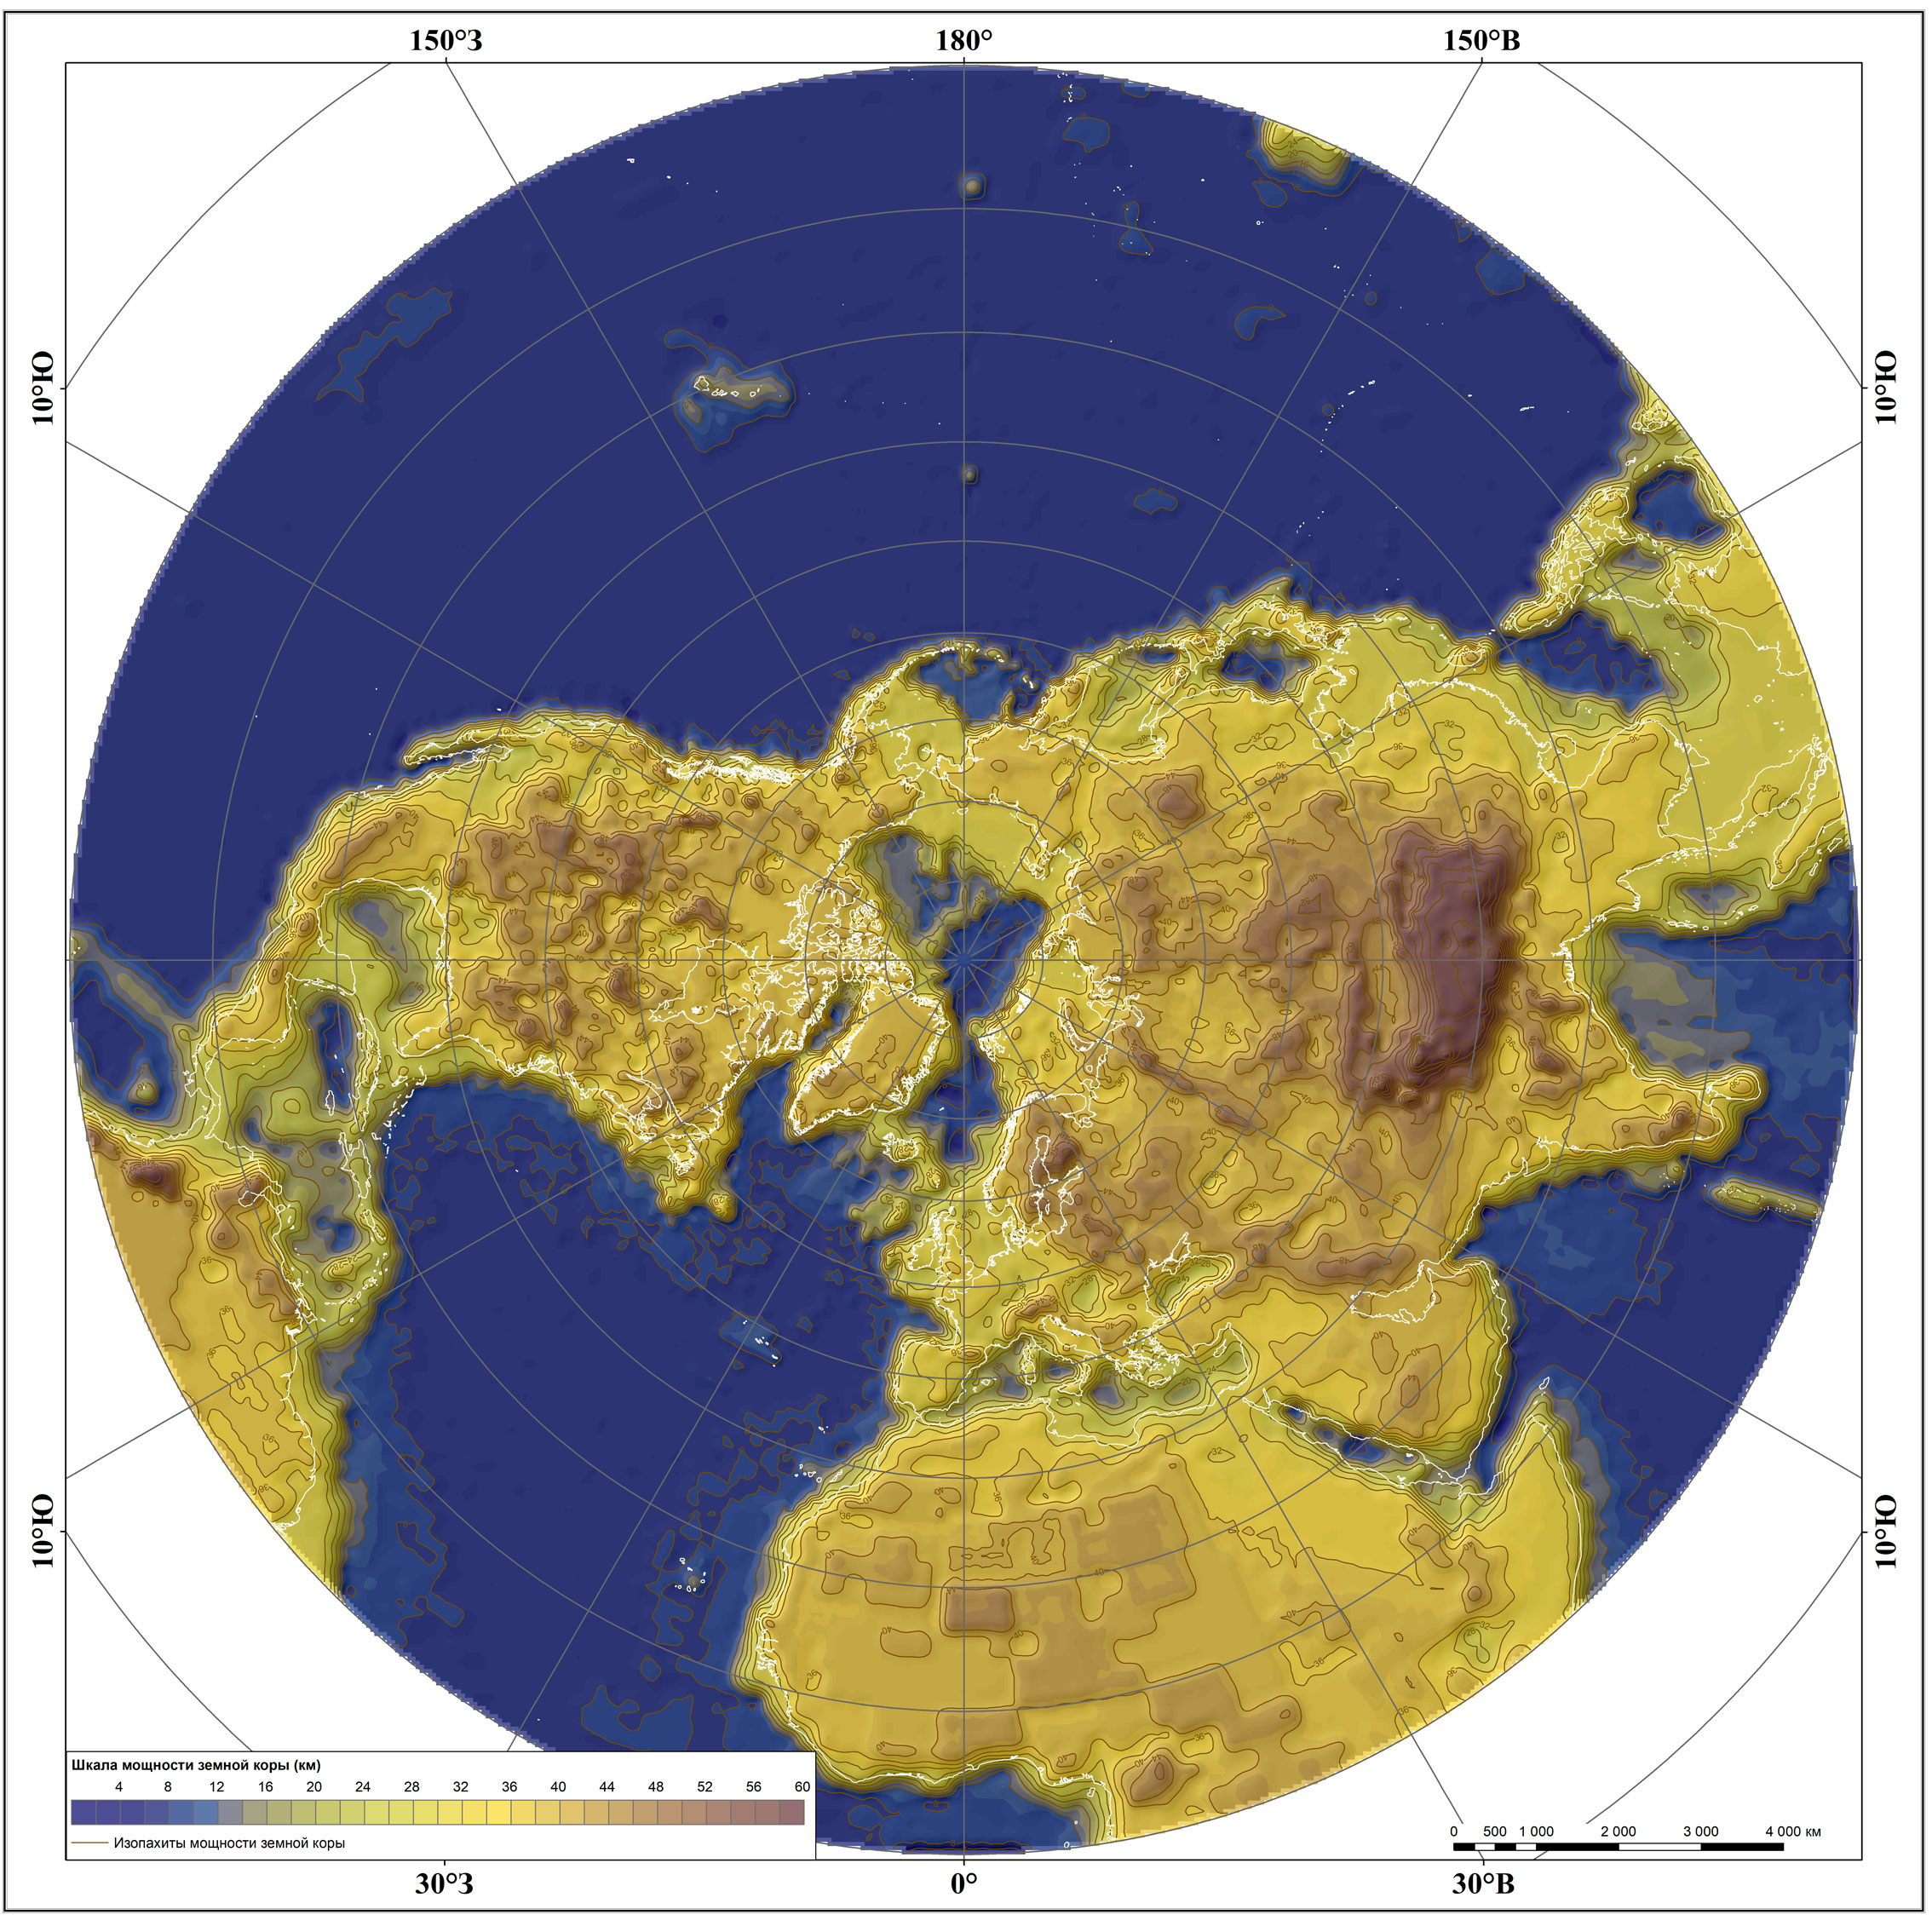
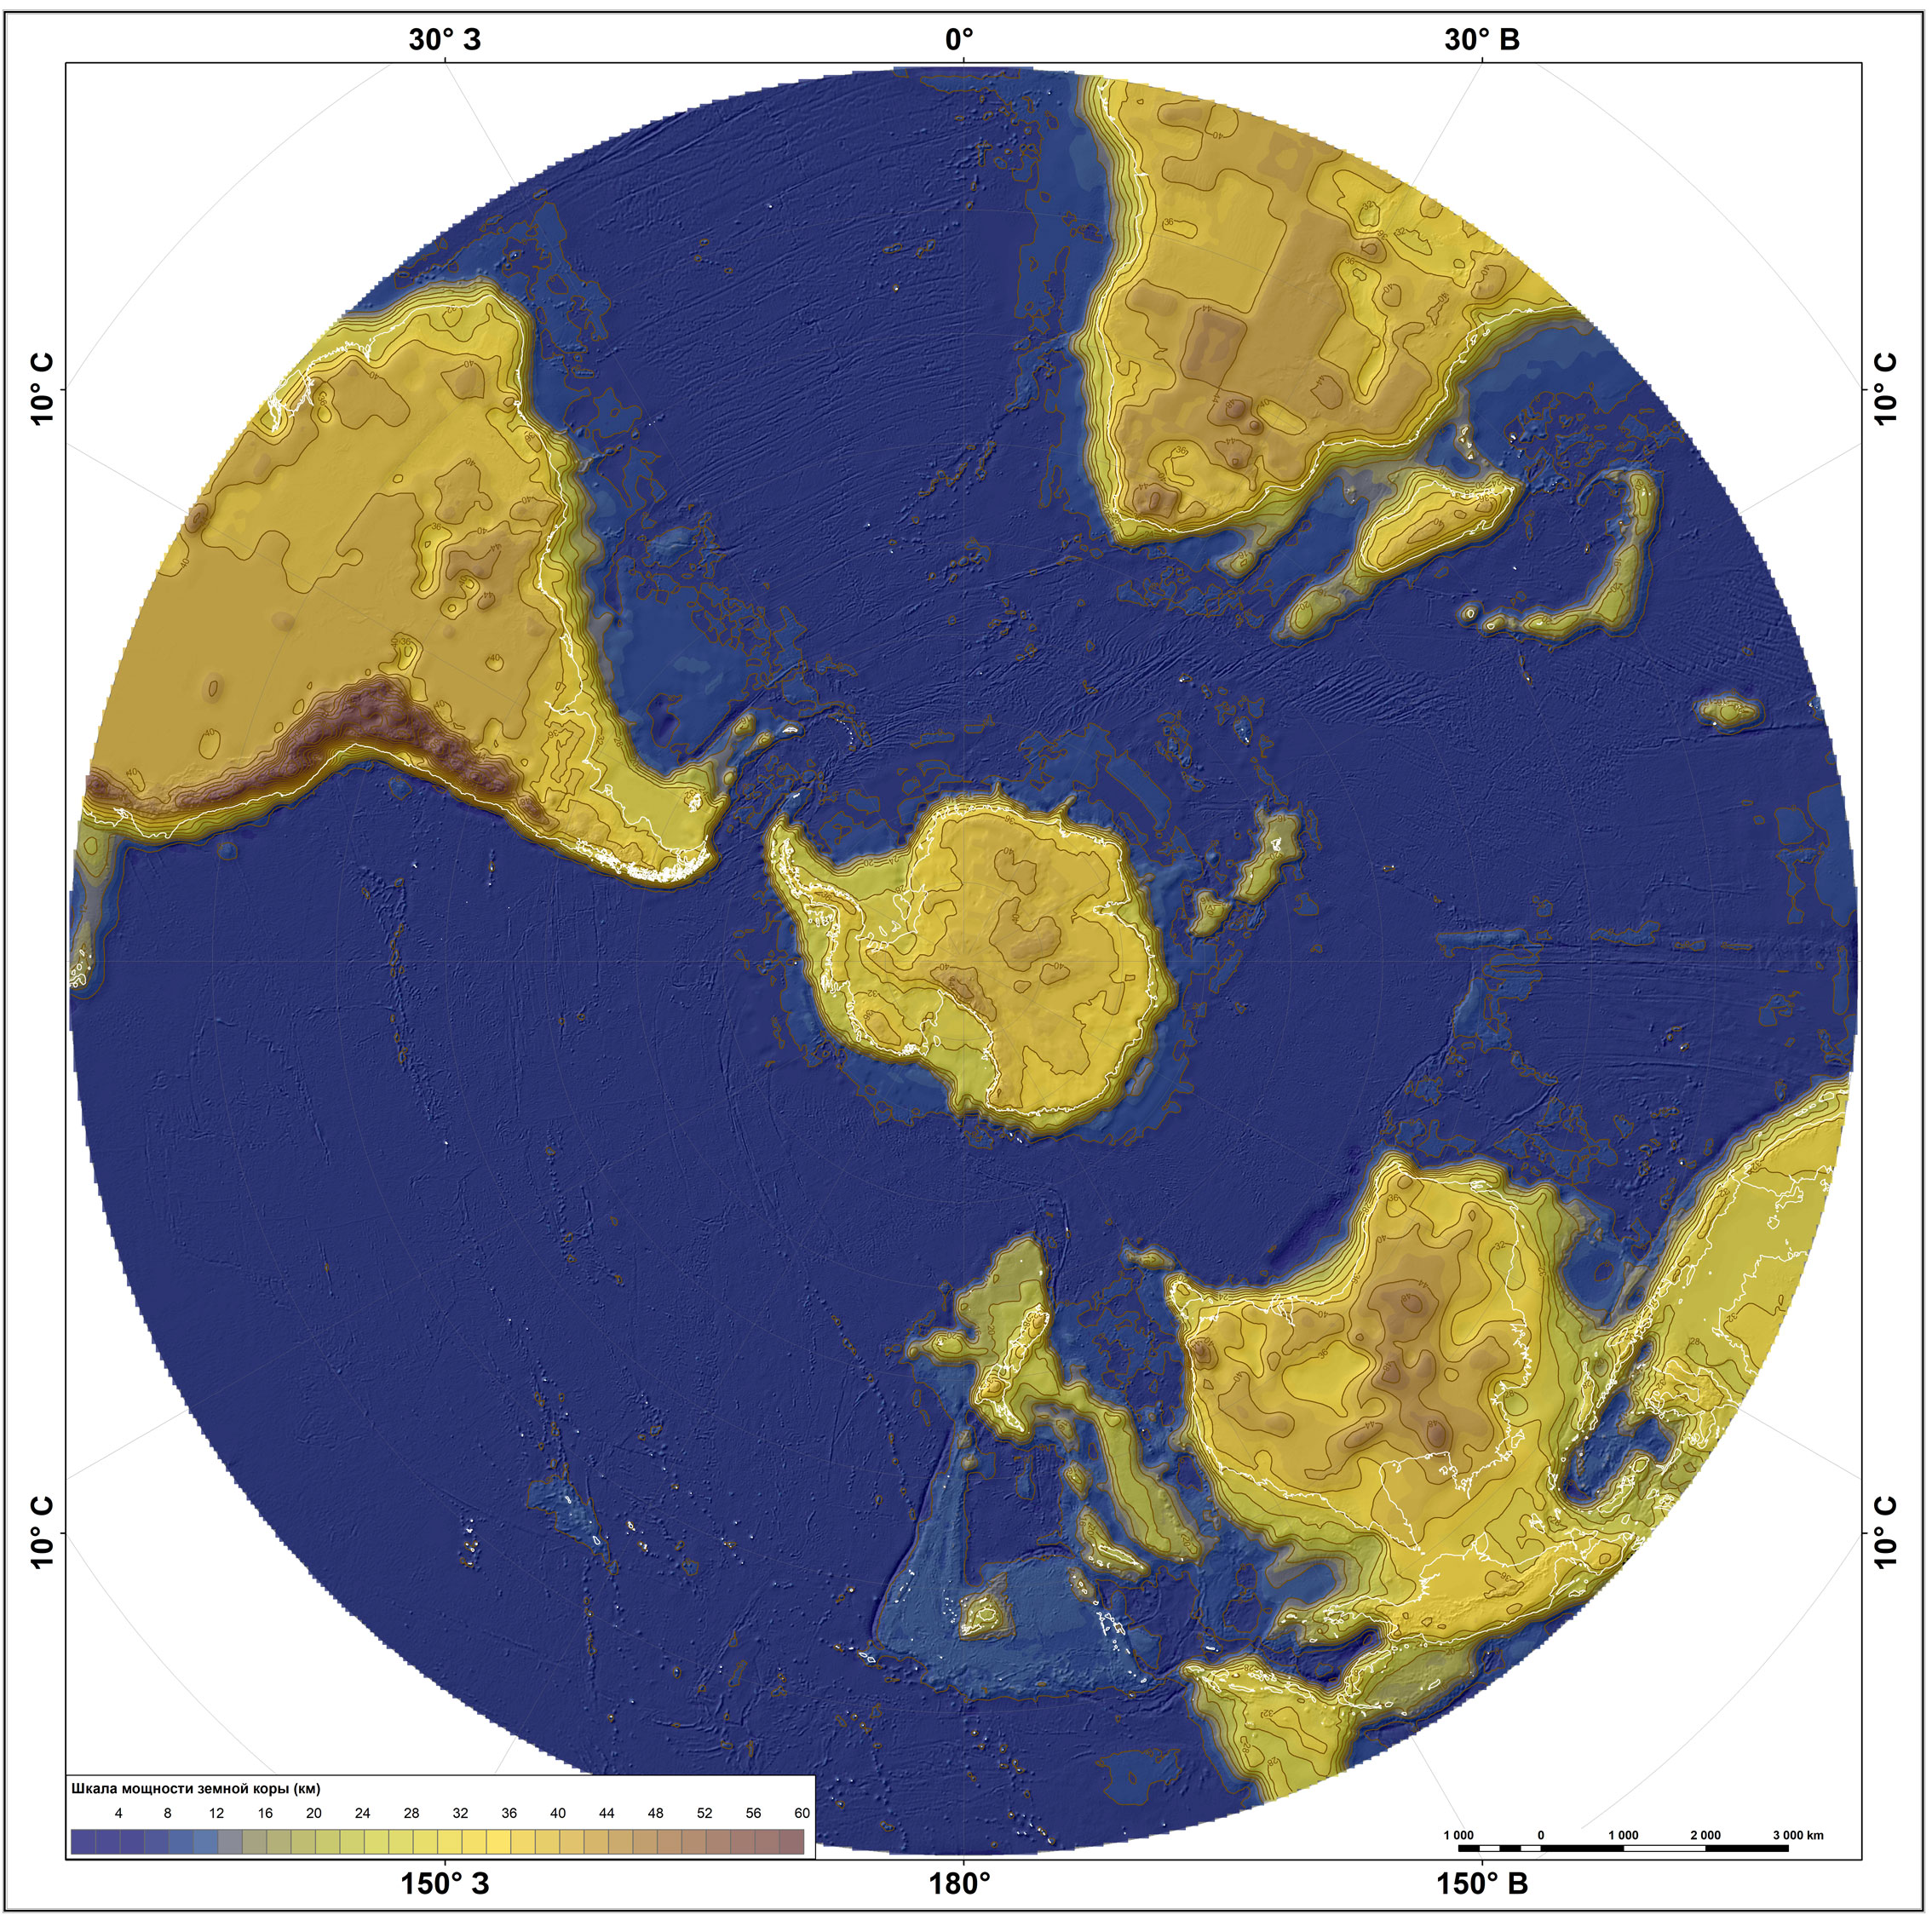
MAP OF THE EARTH'S CRUST THICKNESS
The global crustal model CRUST1.0 was used to calculate the thickness of the Earth’s crust. To build the maps of the Earth’s crust thickness for the Northern and Southern Hemispheres, the point data have been recalculated in corresponding projections used to carry out estimations of digital matrixes with 50x50 km grid; 0.5°×0.5° grid was used to calculate the digital matrix of the world map. The resulting matrixes were used to calculate isopachs of the Earth’s crust at 4 km intervals.
High resolution archive: Earth's crust thickness World; Earth's crust thickness North Hemisphere; Earth's crust thickness South Hemisphere
|
|

|
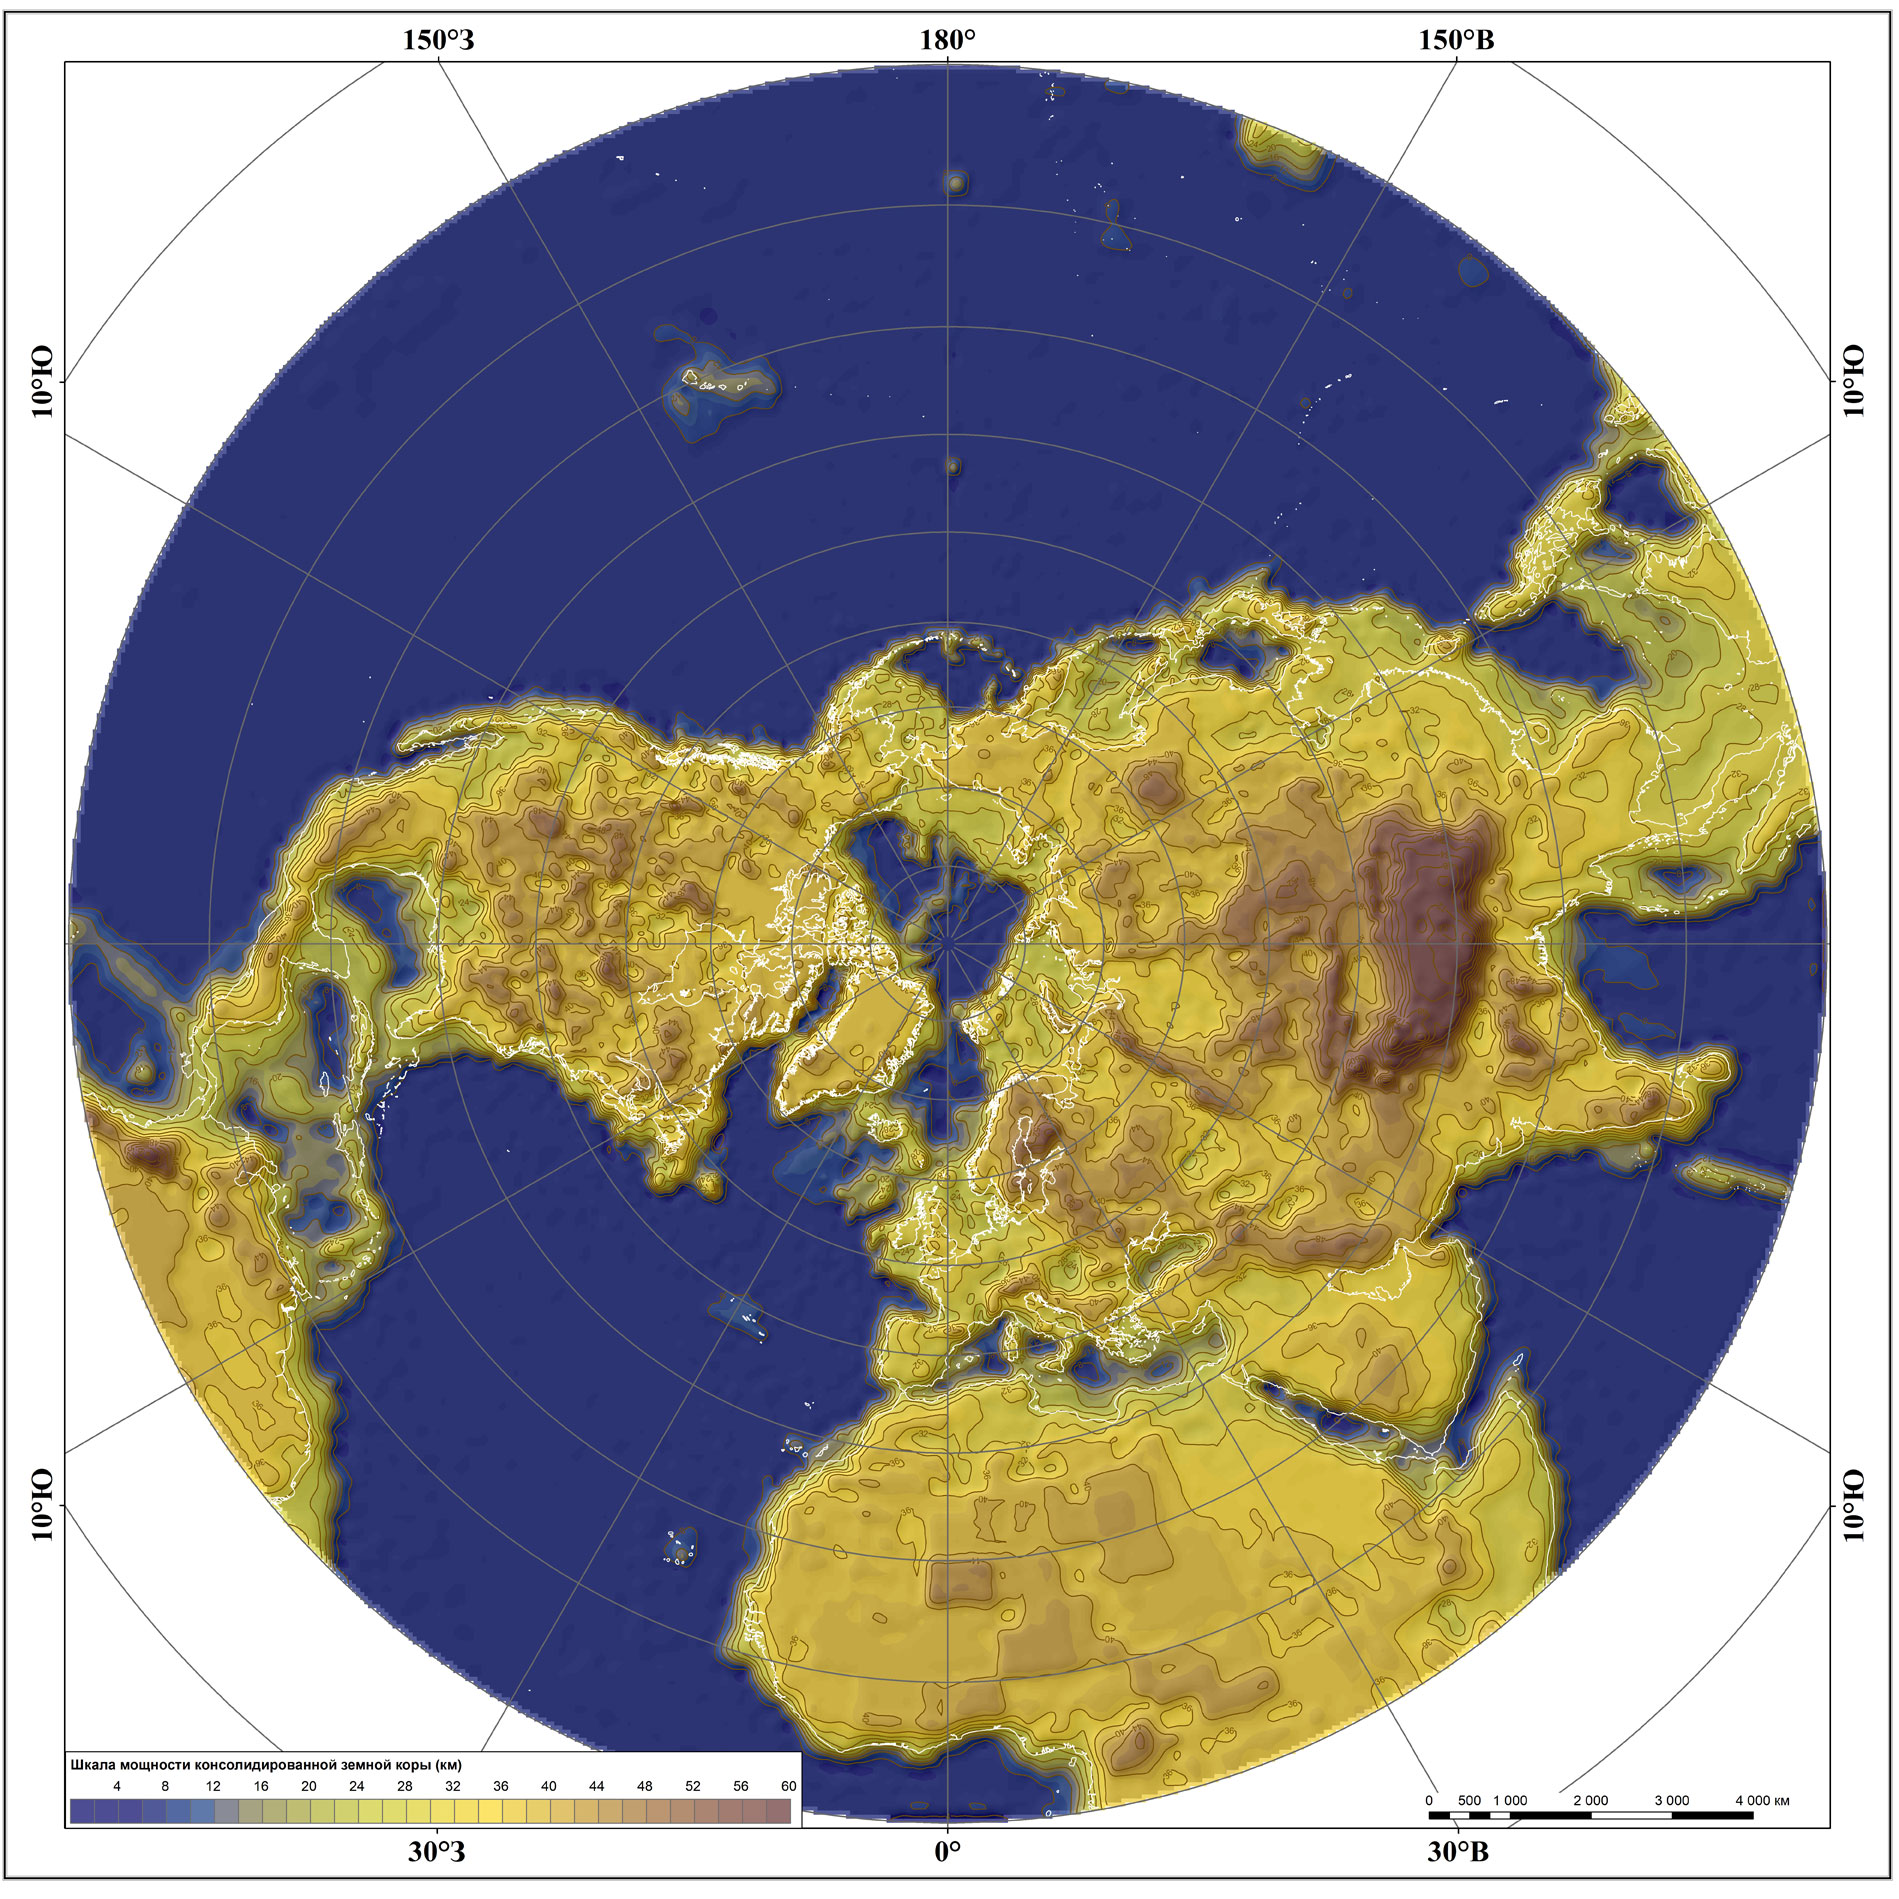
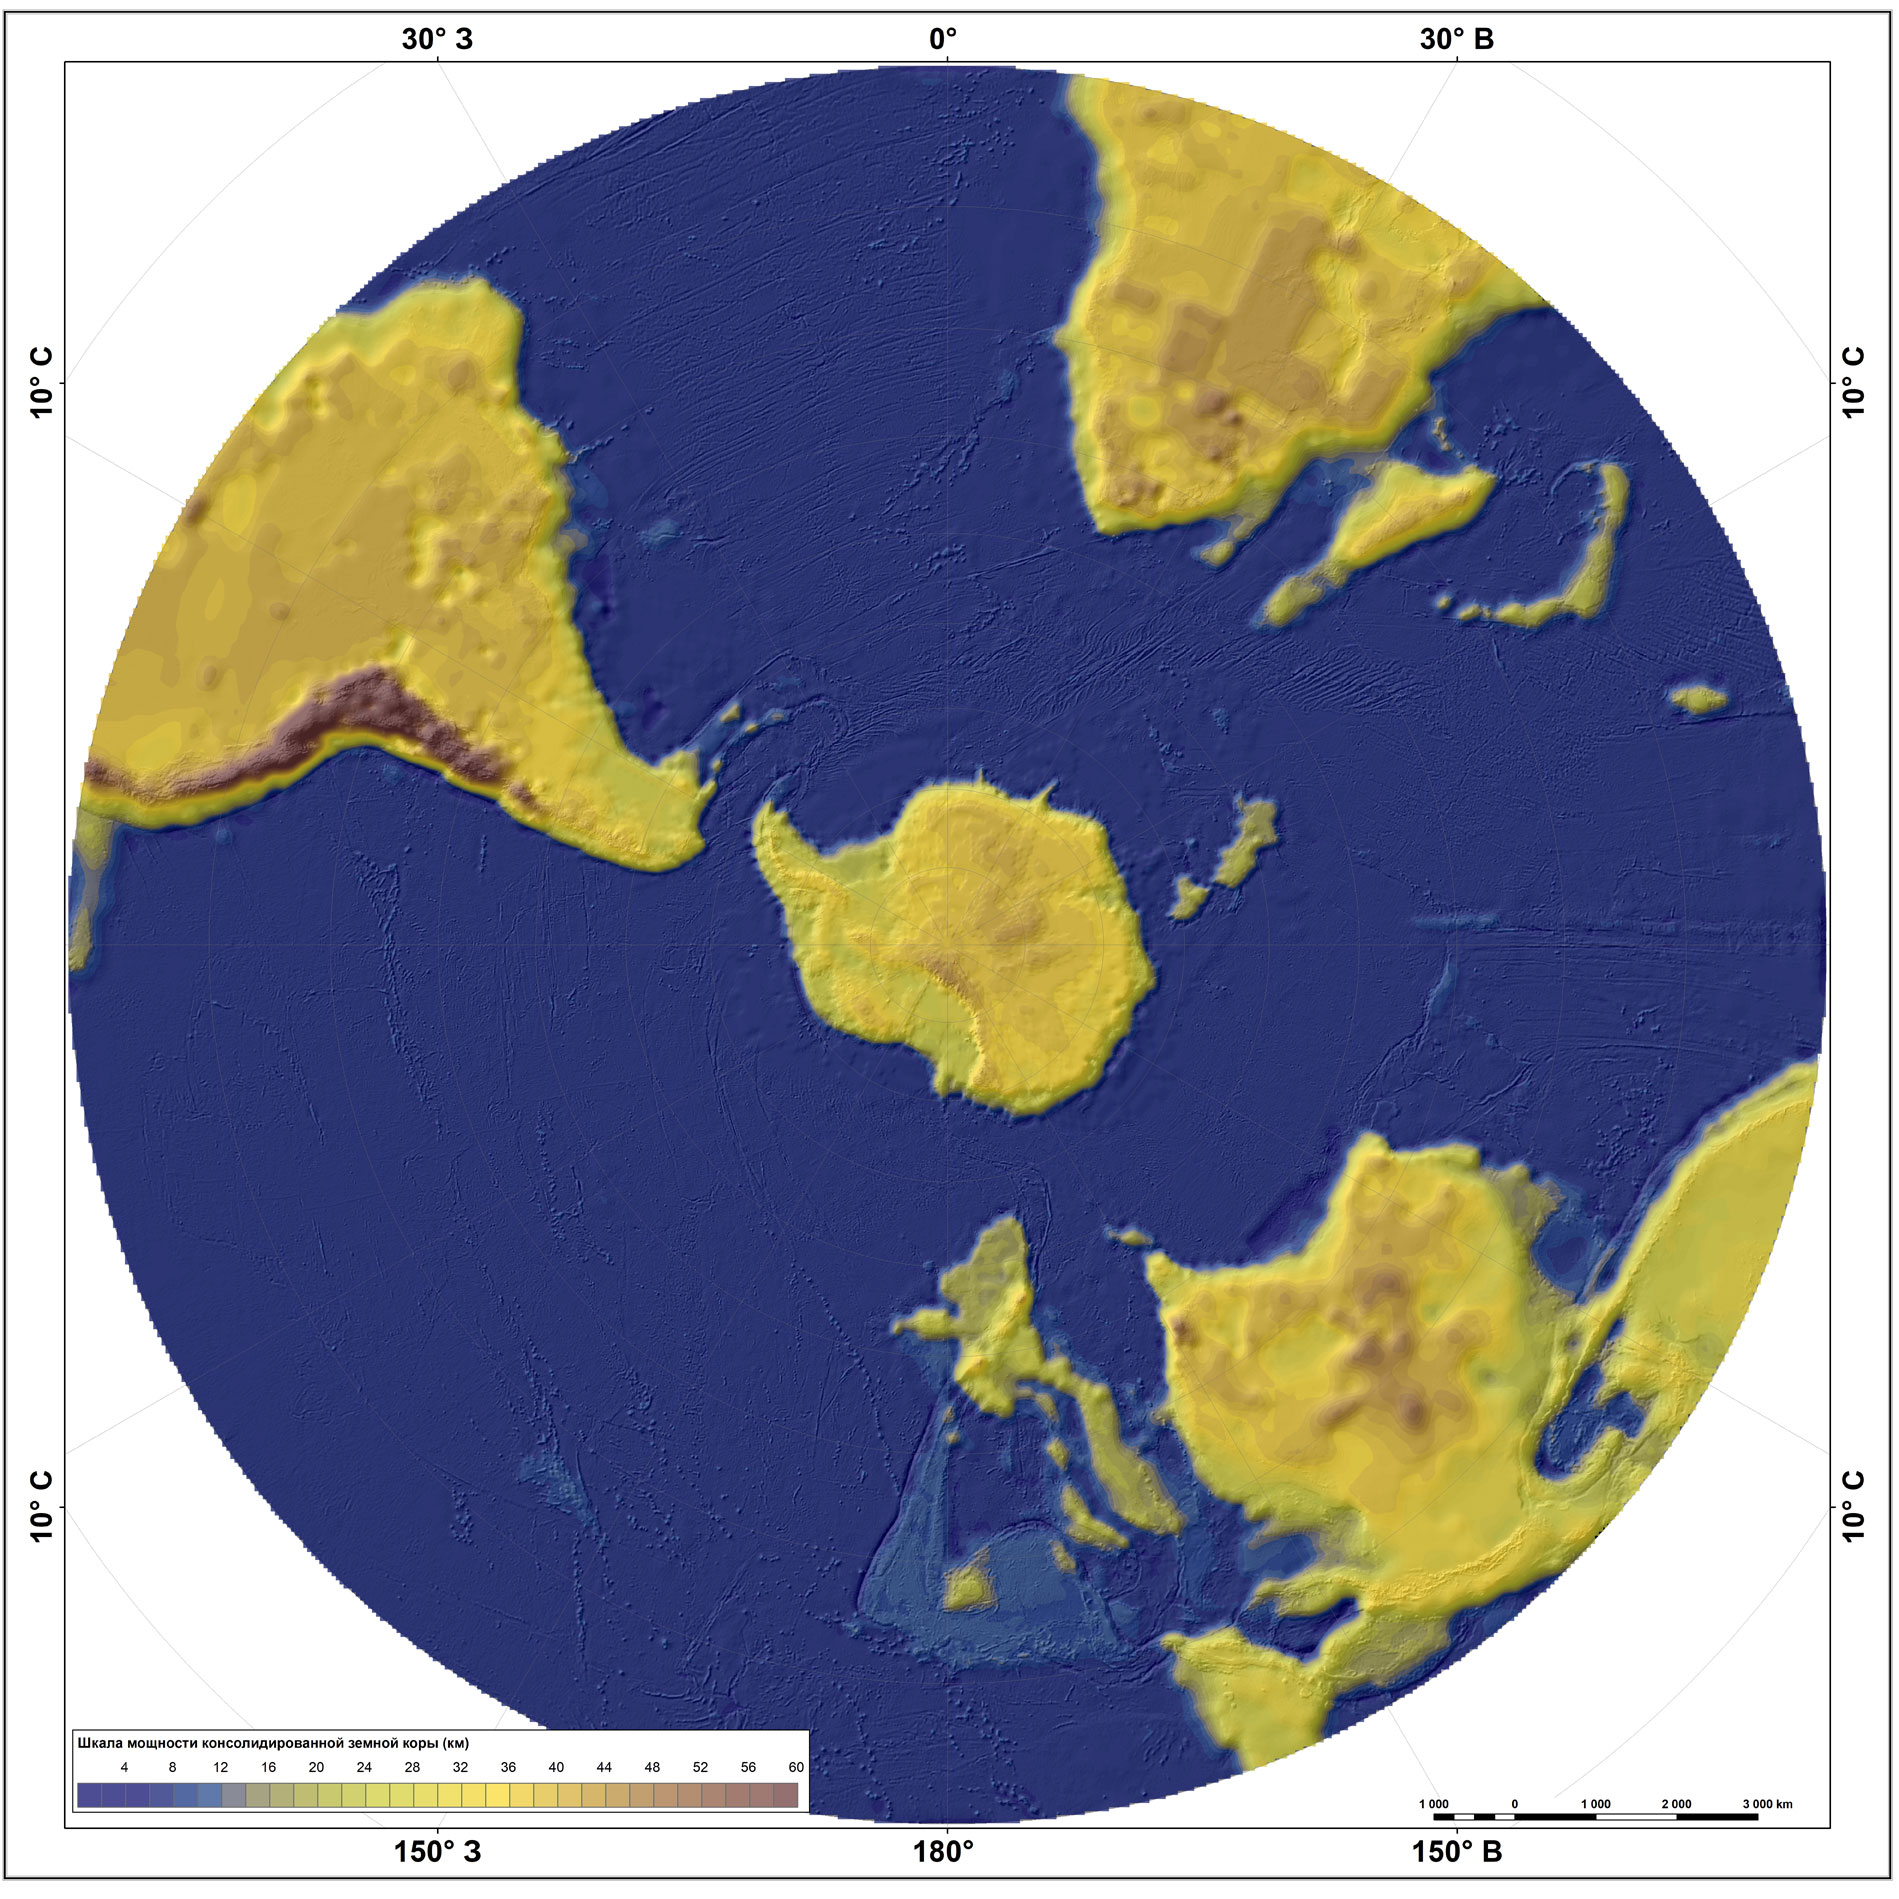
MAP OF THE CONSOLIDATED CRUST THICKNESS
The maps of the consolidated crust thickness were built by subtracting digital matrixes of the sedimentary cover thickness from corresponding digital matrixes of the Earth’s crust thickness. The resulting matrixes were used to calculate isopachs of the consolidated crust thickness at 4 km intervals.
High resolution archive: Consolidated crust thickness World; Consolidated crust thickness North Hemisphere; Consolidated crust thickness South Hemisphere
|
|
|
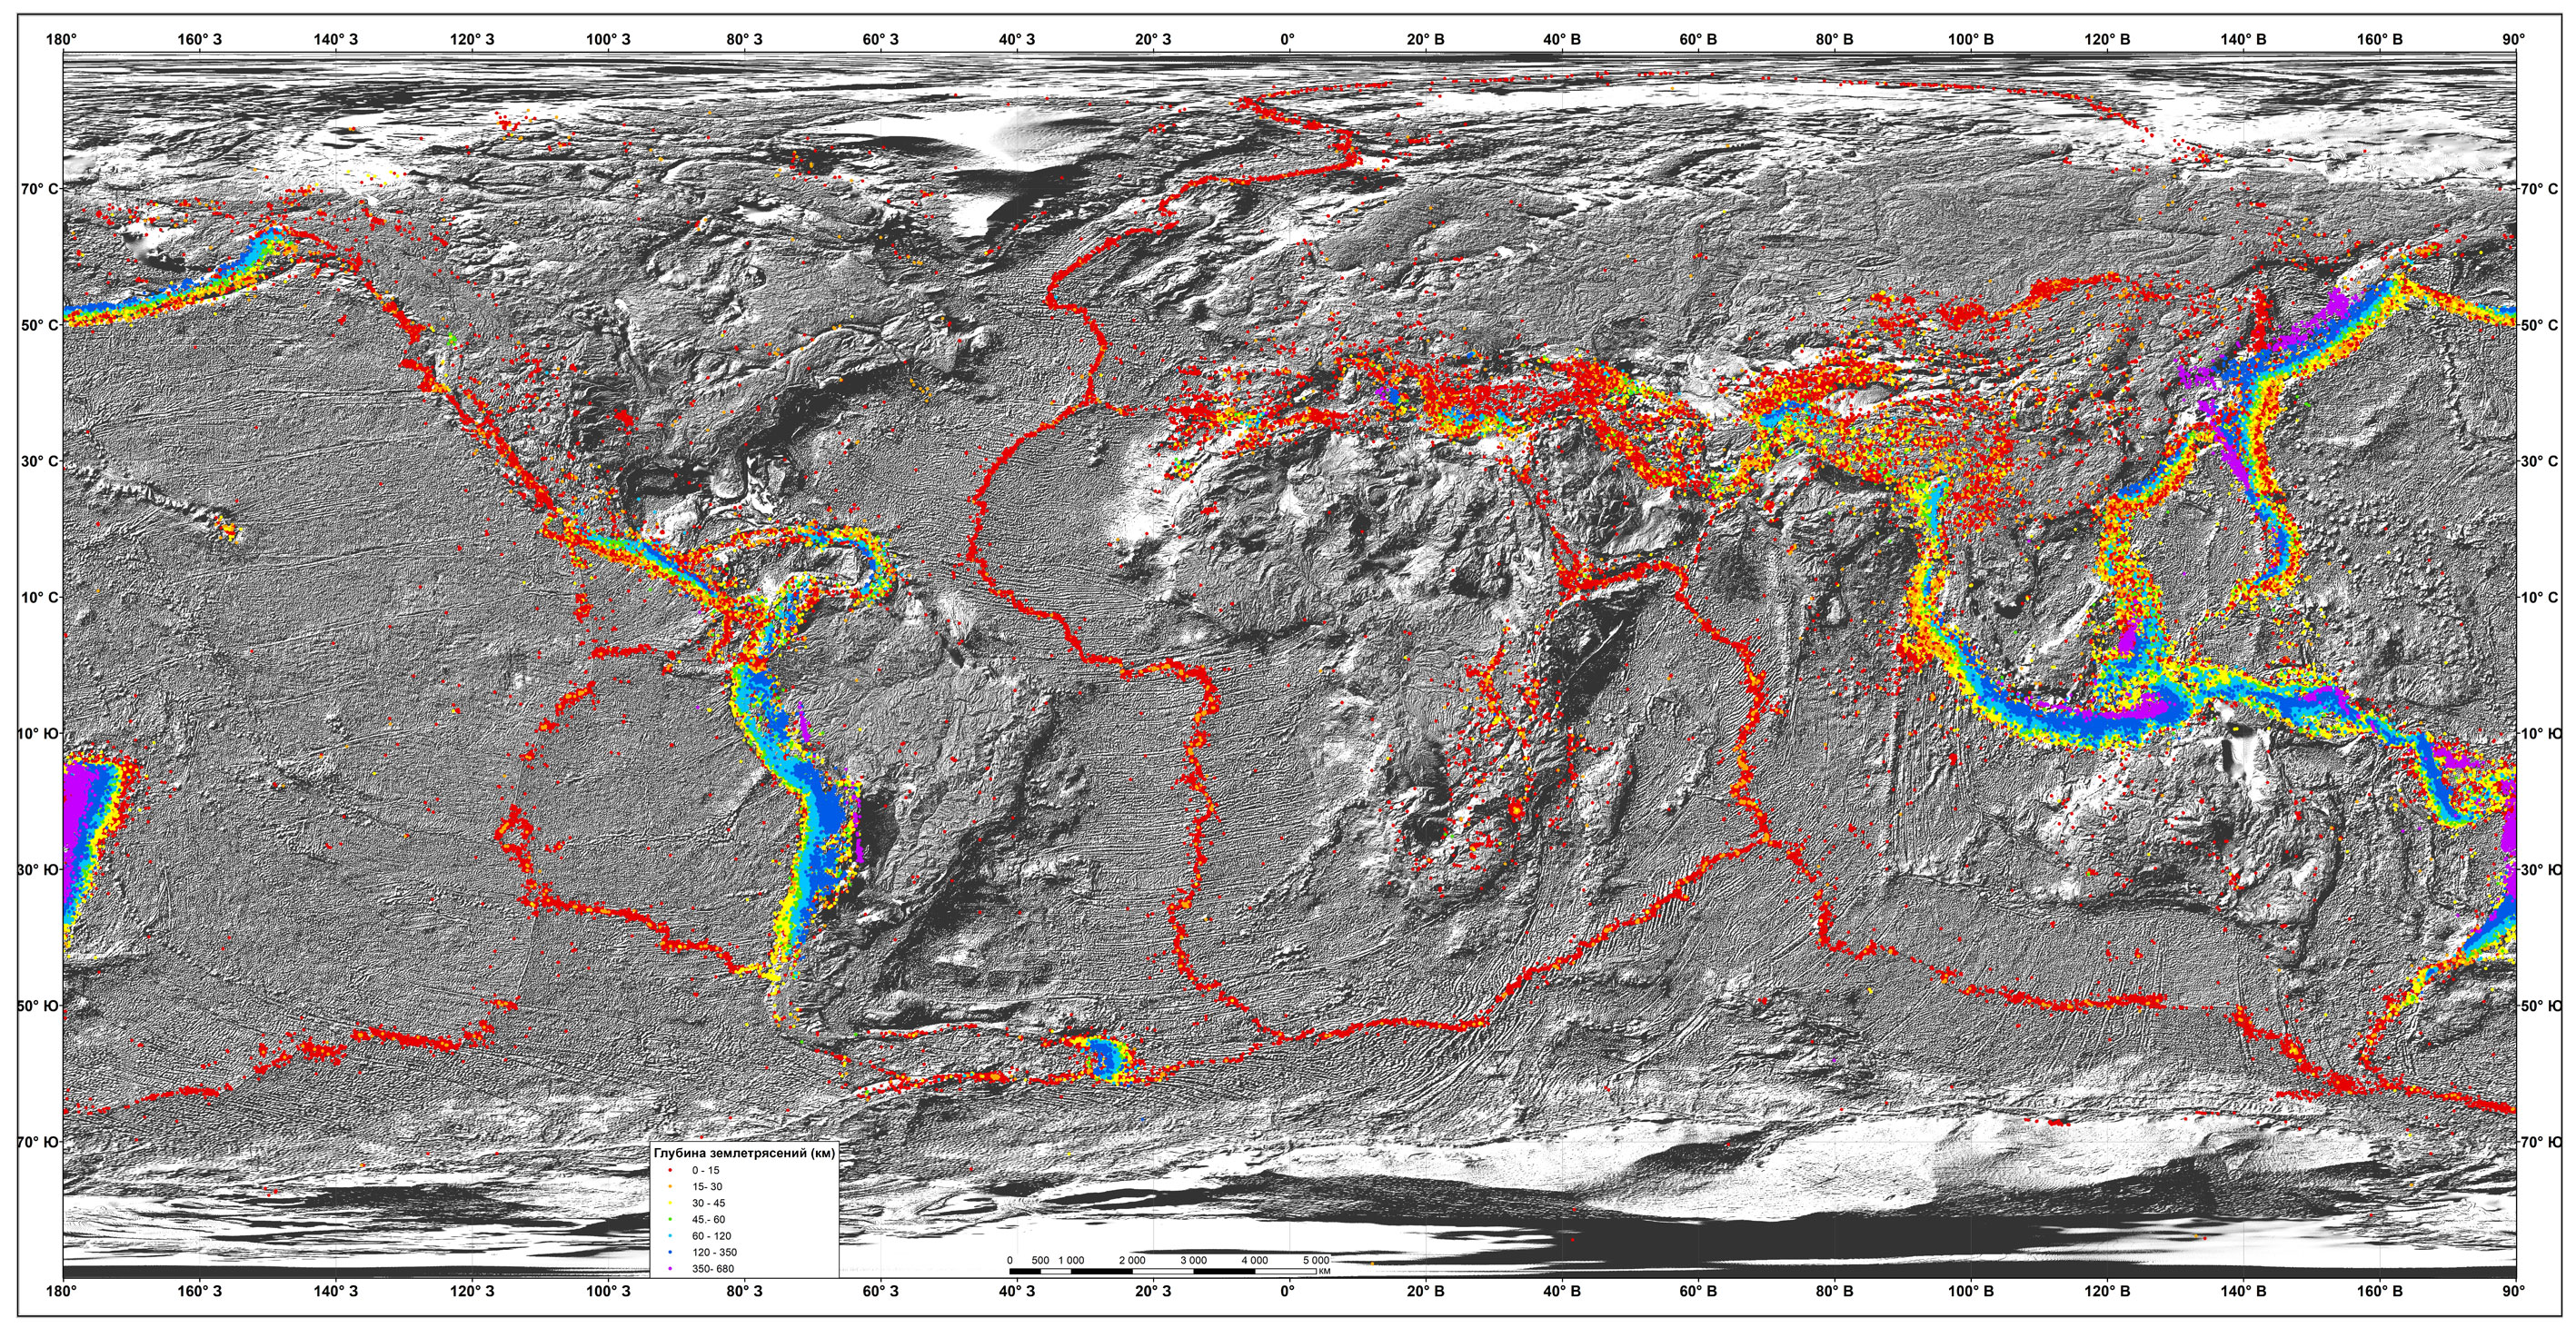
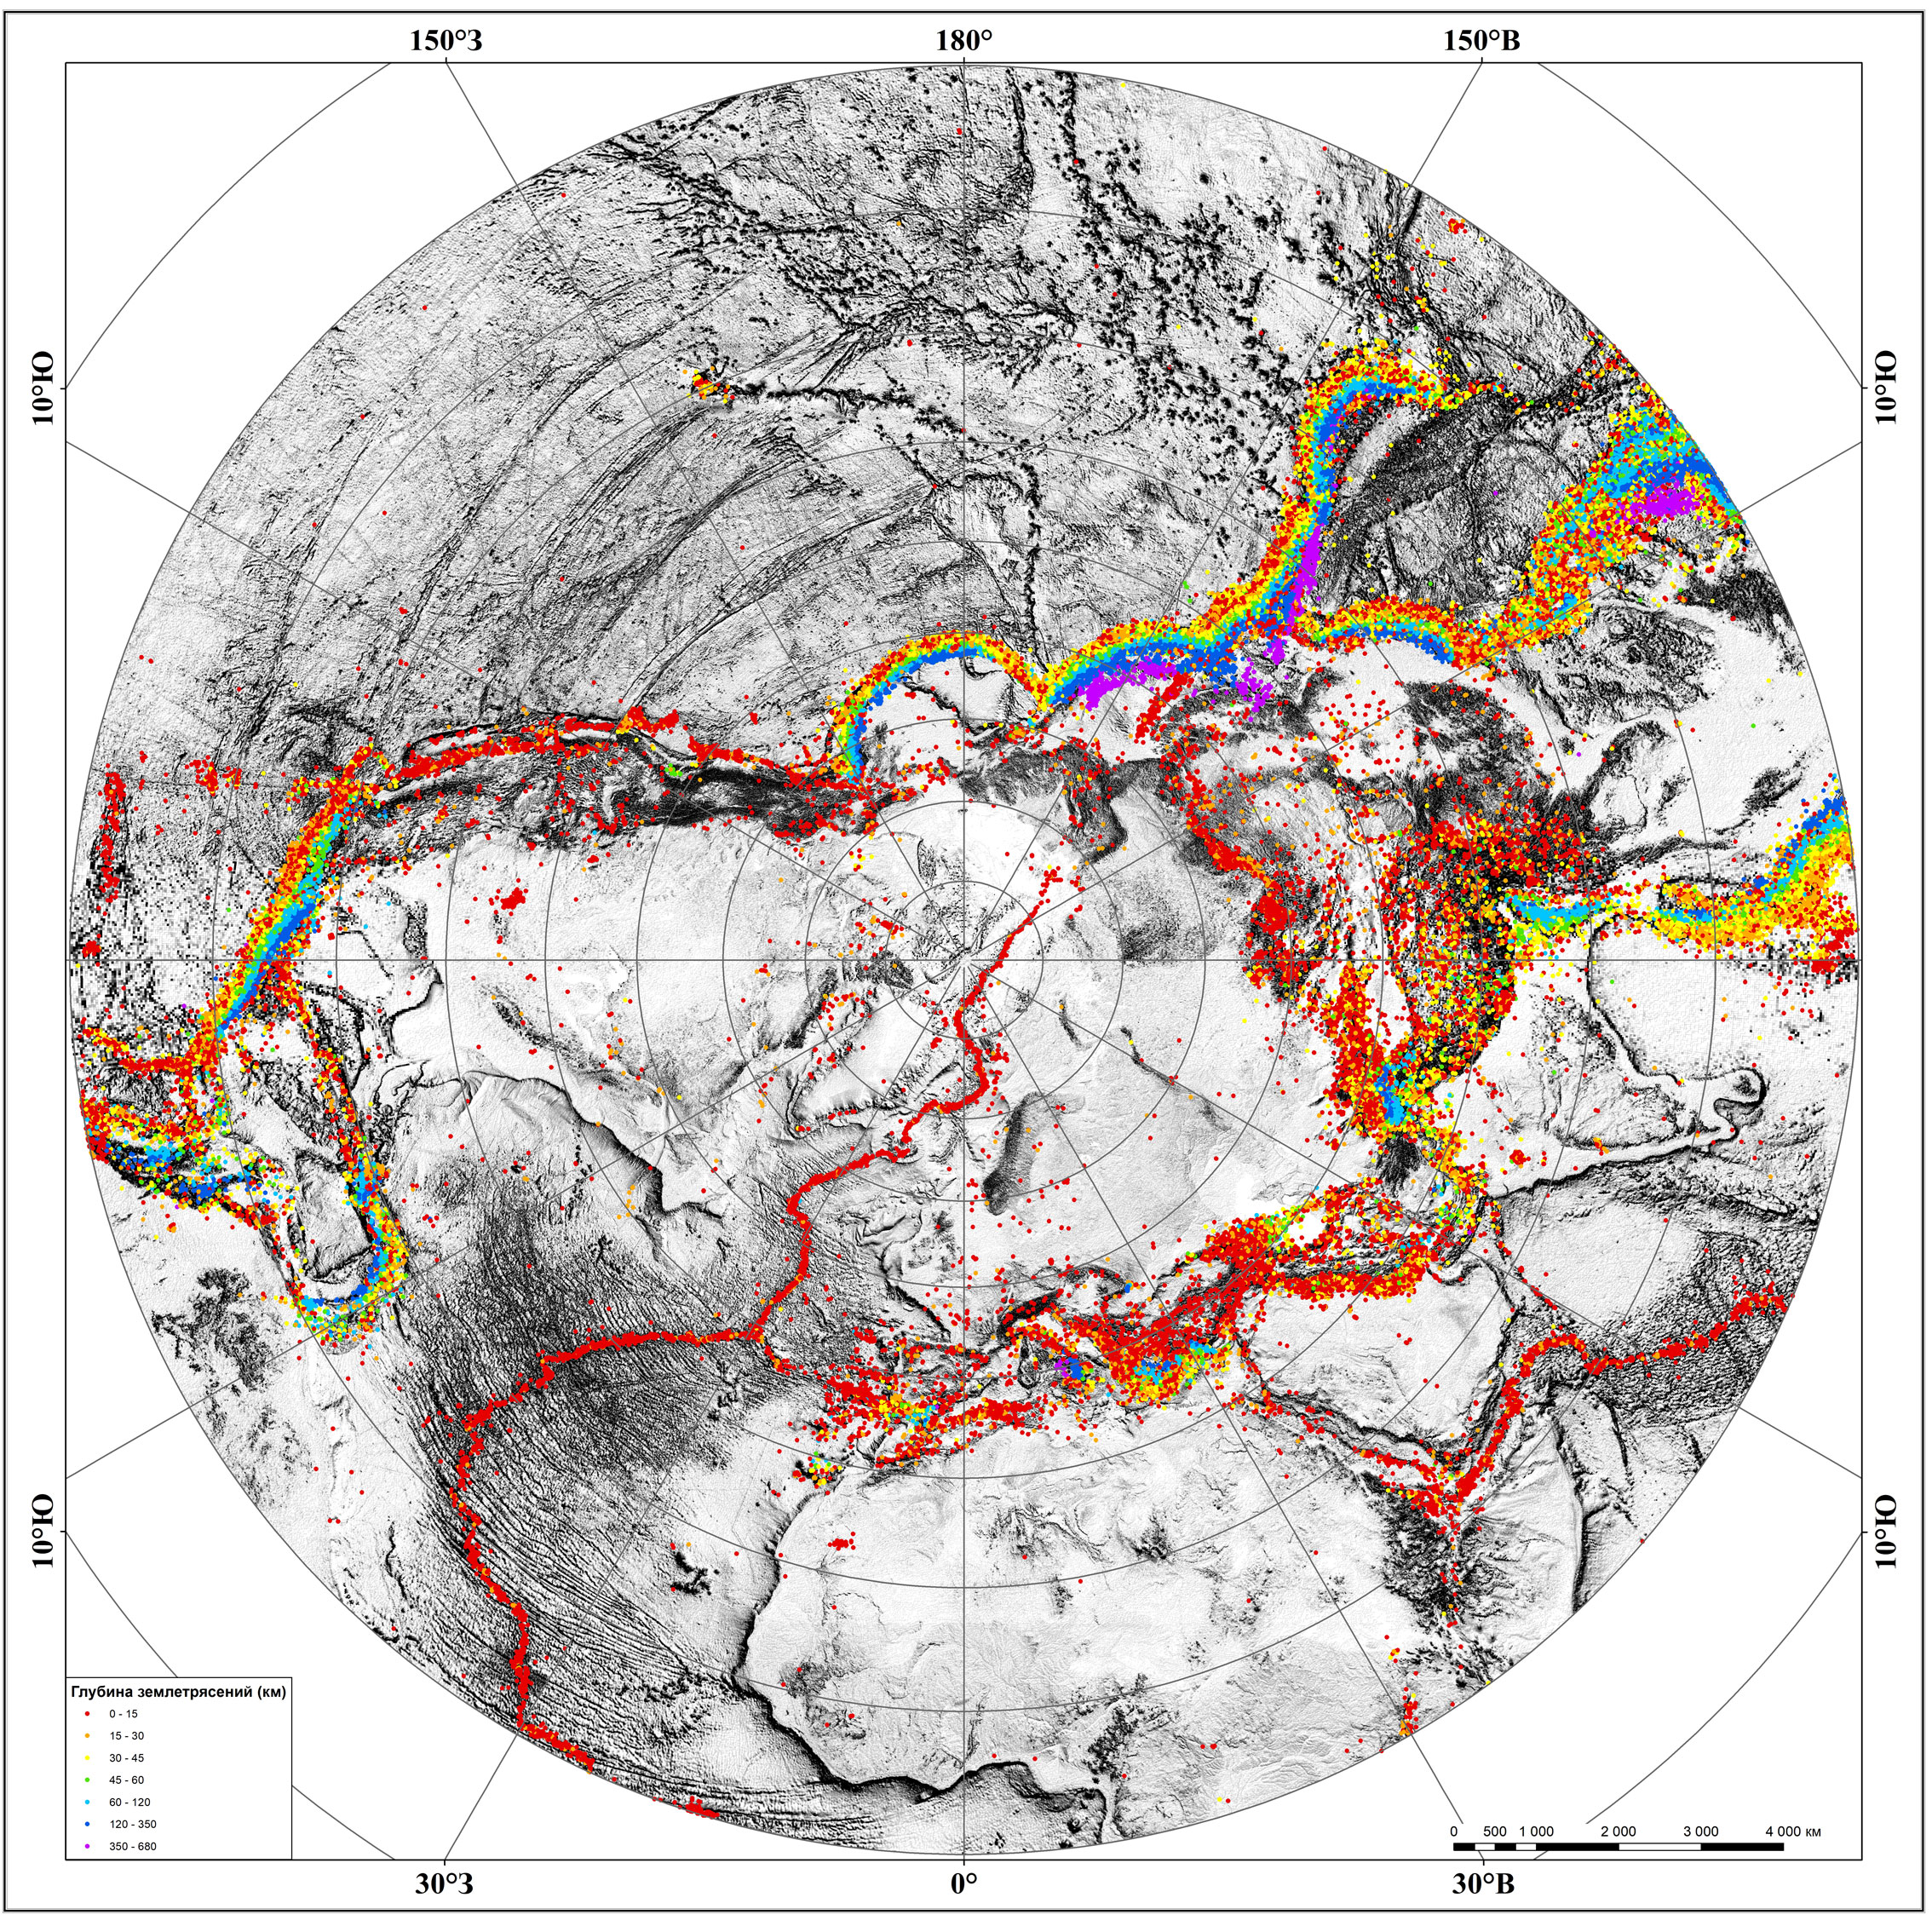
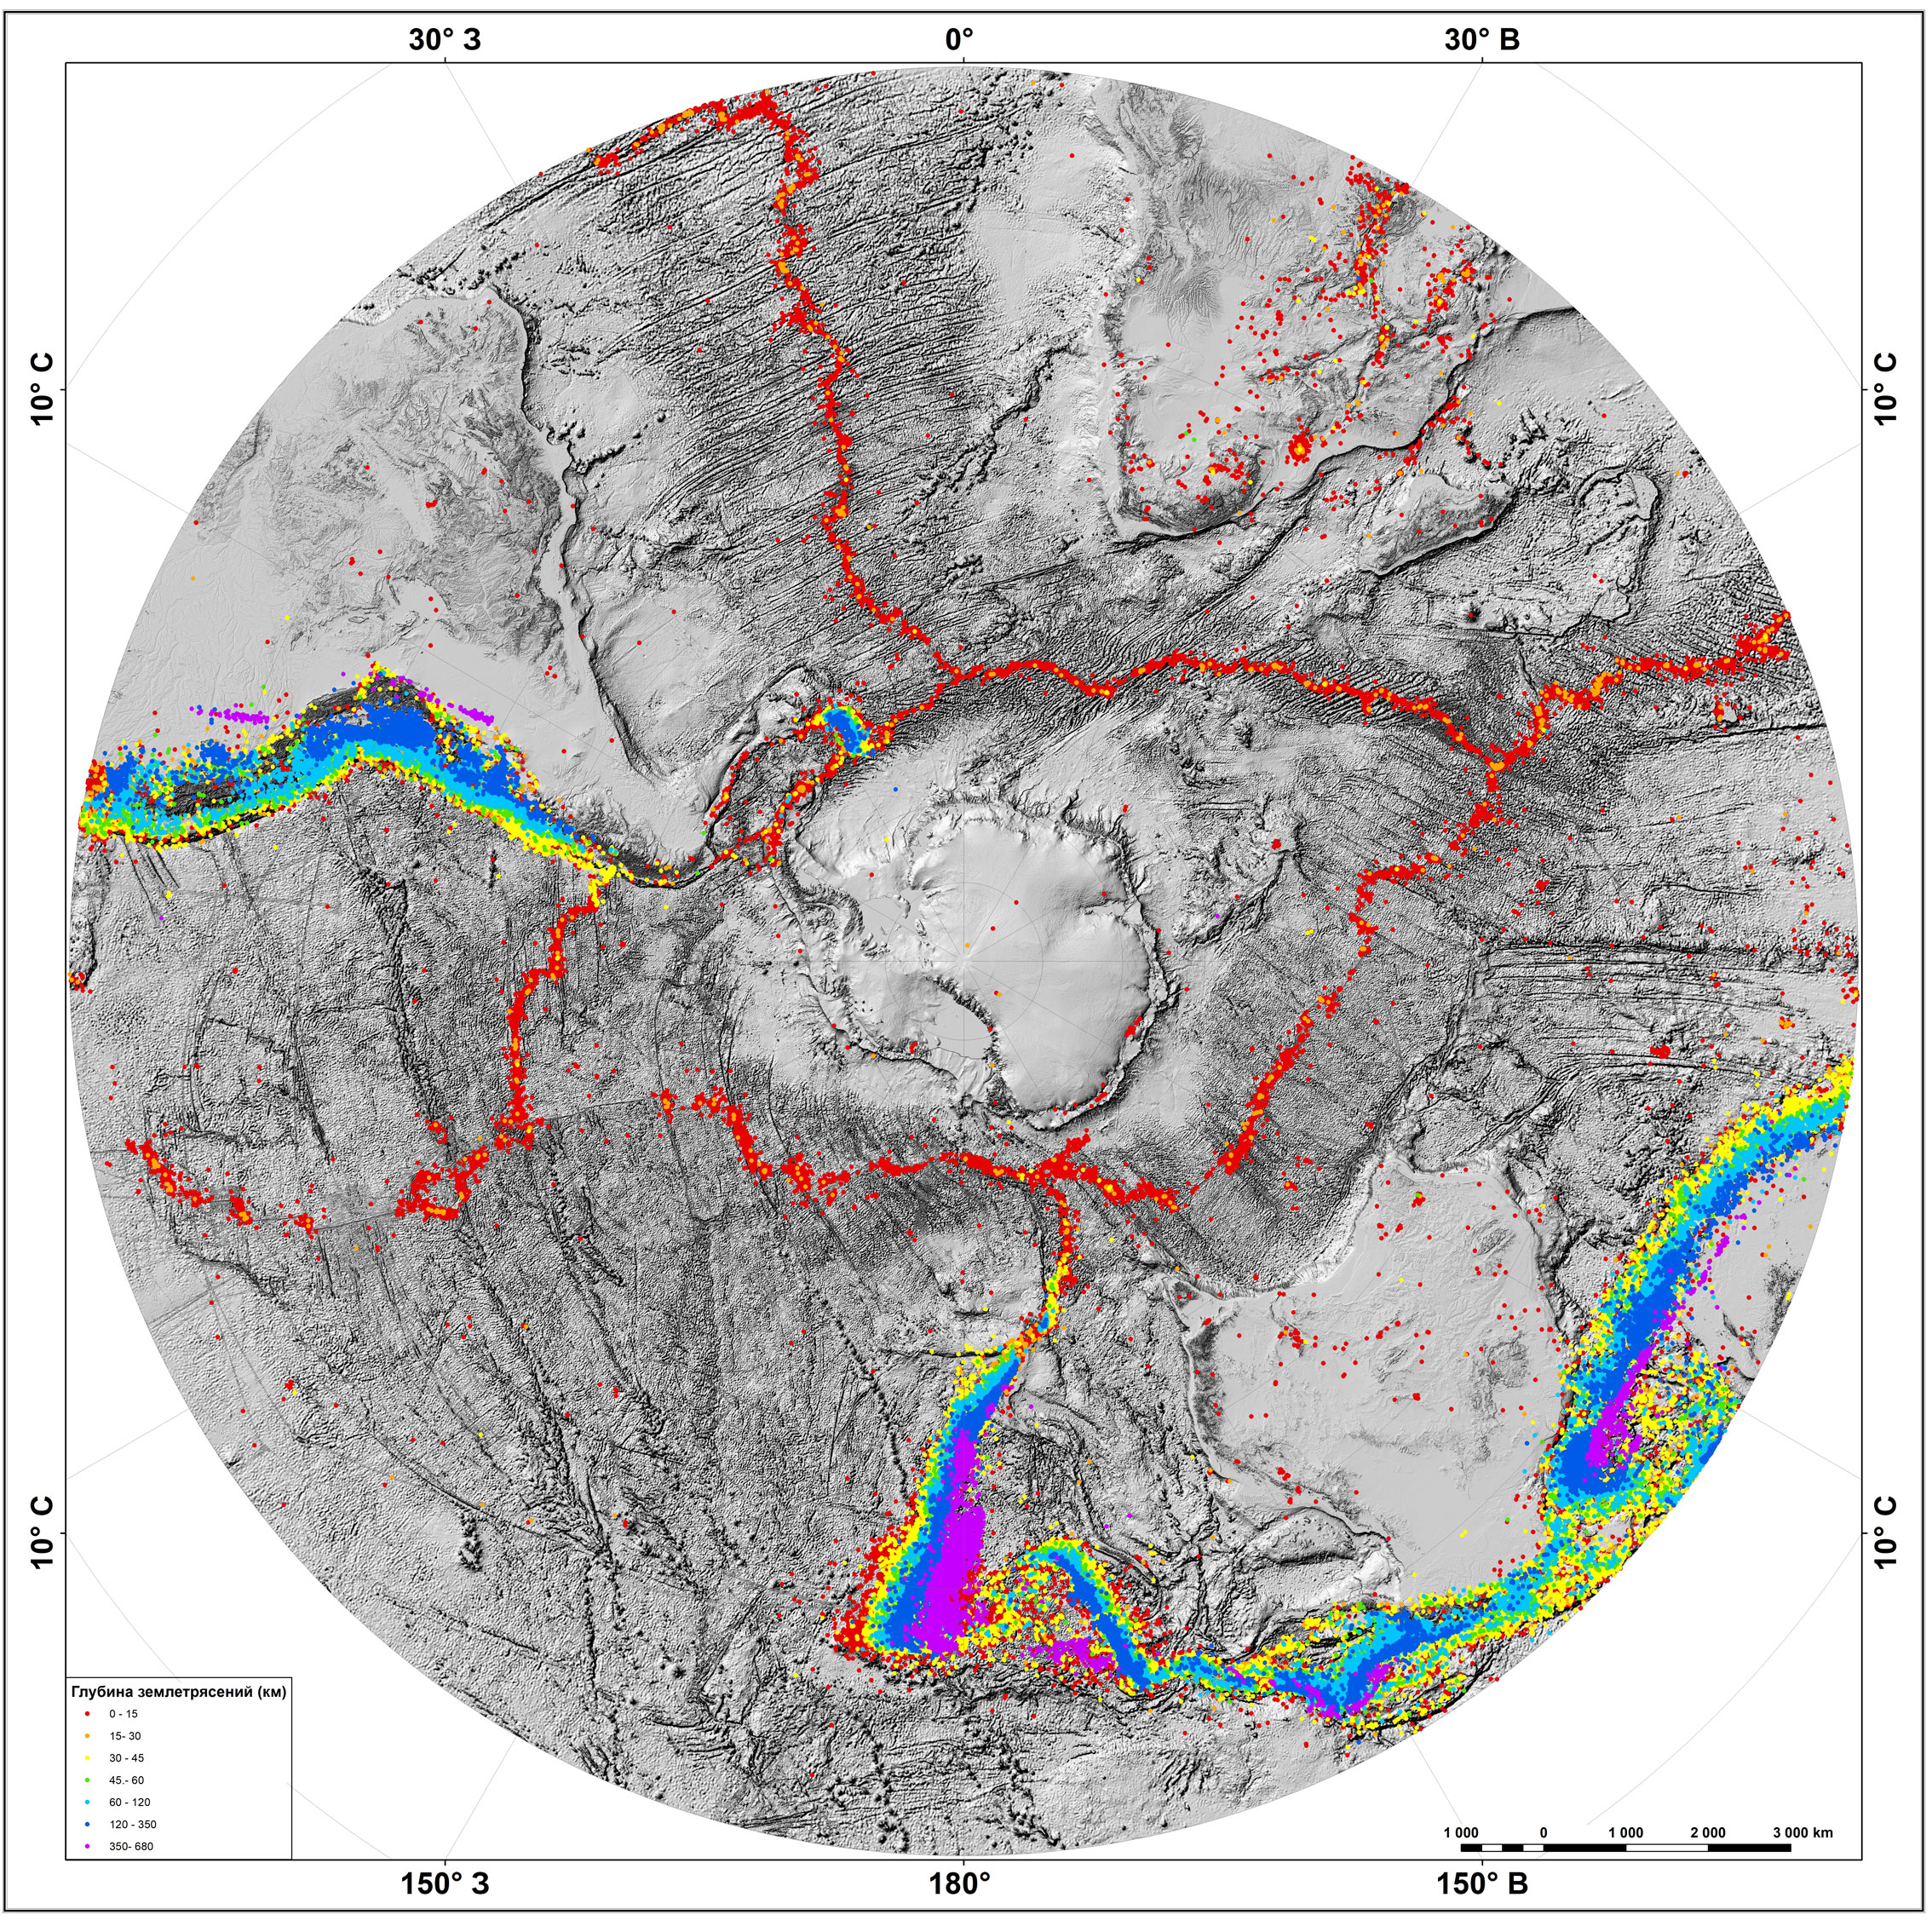
SCHEMATIC MAP OF MODERN SEISMICITY
The point database on depths of earthquakes occurring in 2000-2017 takes advantage of data found in the Global Seismographic Network – www.iris.edu. The colour palette of the scheme reflects 7 grades of earthquake depths. The scheme is represented in the projection of the Tectonic Map being made.
High resolution archive: Schematic map of modern seismicity World; Schematic map of modern seismicity North Hemisphere; Schematic map of modern seismicity South Hemisphere
|
THE CURRENT STATE OF THE TECTONIC MAP OF THE WORLD AT 1:35 M SCALE
The Tectonic map of the World draws on the digital materials (the database and GIS-project) of the Geological Map of the World at 1:35 M scale (CGMW, 2014). The unified legend is used to specify the contours of the geological units and provide their tectonic interpretation
Within the compilation of the Tectonic Map individual map layers are being created for the following blocks:
• Areas with oceanic crust (oceans, internal and marginal seas). The layer attributes show the age determined by means of linear magnetic chrones. The colours used to fill the map units with the oceanic crust were chosen in accordance with the colour palette of the International Stratigraphic Chart.
• Sedimentary platform covers. The layer attributes show the age of the sediments and their thickness. In full compliance with the legend, the map depicts two age groups: ancient – those whose formation falls on the Upper Proterozoic, and young – those with the Paleozoic cover base. Isopach lines show total sedimentary thickness in kilometers.
